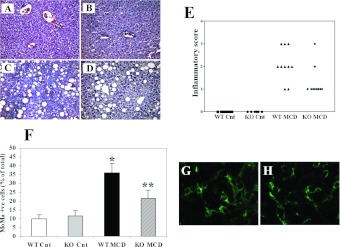
Figure 2. Effects of CCL2 deficiency on liver histology and inflammation following administration of an MCD diet in Balb/C mice.
WT or CCL2-KO mice were fed for 8 weeks on the control diet or the MCD diet. (A–D) At the end of the study protocol, animals were killed and liver sections were stained with haematoxylin and eosin. (A) WT animals fed on the control diet (WT-Cnt); (B) CCL2-KO animals fed on the control diet (KO Cnt); (C) WT animals fed on the MCD diet (WT MCD); (D) CCL2-KO animals fed on the MCD diet (KO MCD). (E) Individual necro-inflammatory scores in the four groups of mice are indicated. (F) Cells positive for the monocyte/macrophage marker MoMa2 were counted in slides from each group of mice indicated as above. *P<0.01 compared with WT animals fed on the control diet; **P<0.01 compared with WT animals fed on the MCD diet. (G,H) Representative immunofluorescence staining for MoMa2-positive cells (green) in WT animals fed on the MCD diet (G) and CCL2-KO animals fed on the MCD diet (H).

