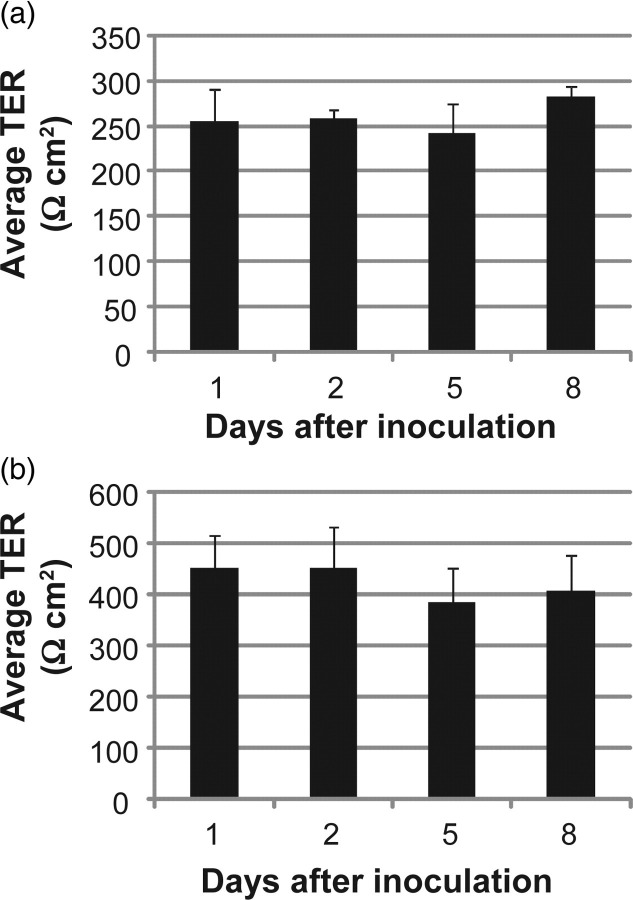
Figure 3.
Transepithelial electrical resistance (TER) of EpiAirway (a) and ALI NHBE (b) cell cultures. (a) EpiAirway cultures were inoculated with strain R2846 and the TER was measured during co-culture. (b) NHBE cell cultures at the ALI were inoculated with strain R2846 and the TER was measured during co-culture. Horizontal axes denote time after inoculation for each reading. Error bars are SD. ALI, air–liquid interface; NHBE, normal human bronchial epithelial

