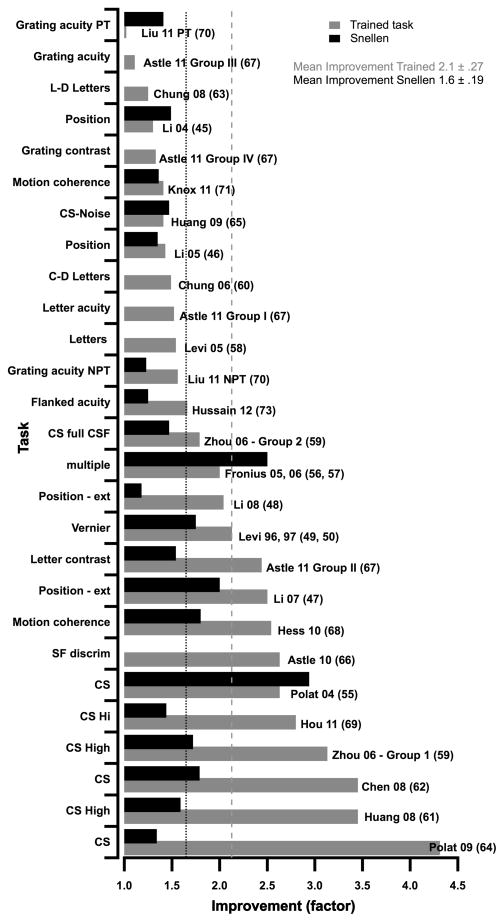
Figure 3.
The improvement in performance (expressed as a factor along the abscissa) following PL on different tasks from previous studies (ordinate). Improvement on the trained task is shown by the gray bars and in Snellen acuity by the black bars. The results are ordered on the improvement on the trained task, from least (top) to most (bottom).

