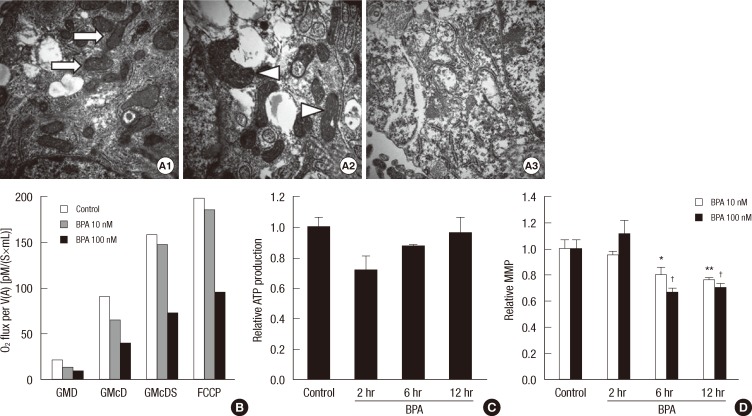
Fig. 6.
Structure and function of the mitochondria in HepG2 cells treated with BPA. (A) Mitochondrial morphology of HepG2 cells by transmission electron microscopy (300,000 × magnification). Control HepG2 cells (A1), 10 nM BPA-treated HepG2 cells (A2), and 100 nM BPA-treated HepG2 cells (A3). Normal mitochondria (arrows) and swollen and cristae-disrupted mitochondria (arrowheads). (B) Oxygen consumption rate of HepG2 cells. GMD, glutamate + malate + ADP; GMcD, GMD + cytochrome c; GMcDS, GMcD + succinate; FCCP, uncoupler. (C) ATP production after the treatment with 100 nM BPA. (D) MMP after the treatment with 10 or 100 nM BPA (*P < 0.05 compared to control; †P < 0.01 compared to control).

