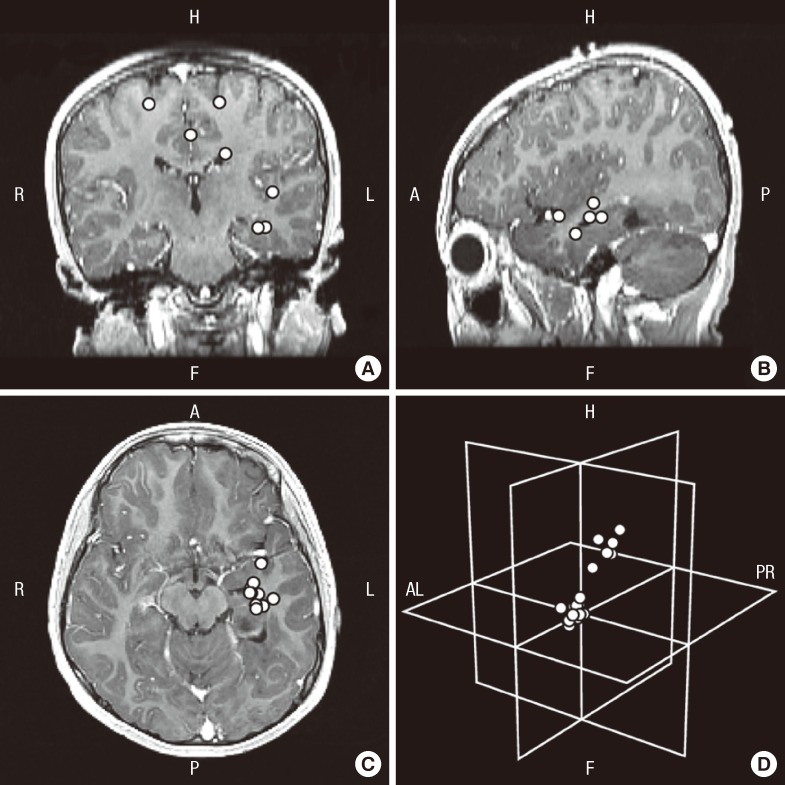
Fig. 2.
MEG spike sources clustered around the lesion and scattered in patient 12. (A-C) Axial, sagittal, and coronal contrast-enhanced T1-weighted brain magnetic resonance imaging (MRI) show clusters and distant scatters (overlaid on a single brain MRI image). (D) MEG spike sources presented in an imaginary three-dimensional plane show the distribution of MEG spike sources of clusters and scatters. R, right; L, left; H, head; F, foot; AL, anterior left; PR, posterior right; A, anterior; P, posterior.

