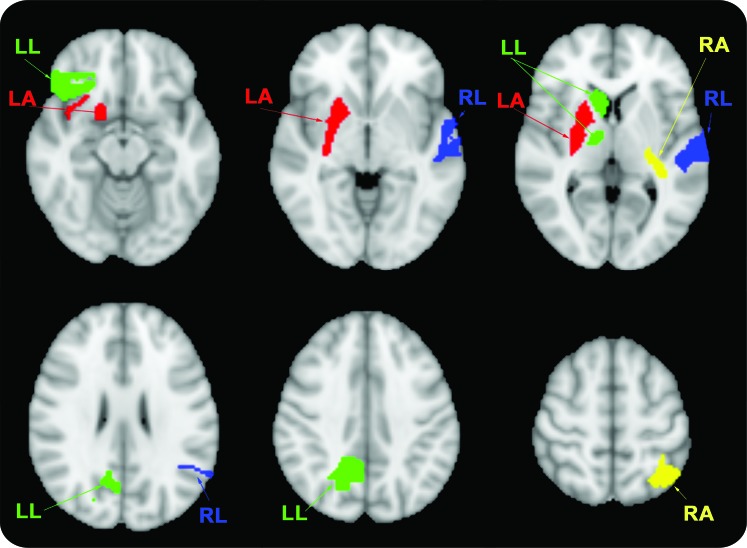
Figure. Graphic representation of cortical regions that were independent predictors of motor improvement in patients with limb paresis.
Right arm (RA, yellow): relative mean transit time (rMTT) of both the left superior parietal lobule gray matter and retrolenticular internal capsule; left arm (LA, red): relative cerebral blood flow (rCBF) of both the right lower anterior insular cortex and putamen; right leg (RL, blue): rMTT of the left superior temporal gyrus white matter (WM); left leg (LL, green): relative cerebral blood volume (rCBV) of right caudate nucleus, rCBF of parietal lobe precuneus WM, and rCBF of inferior frontal lobe WM.

