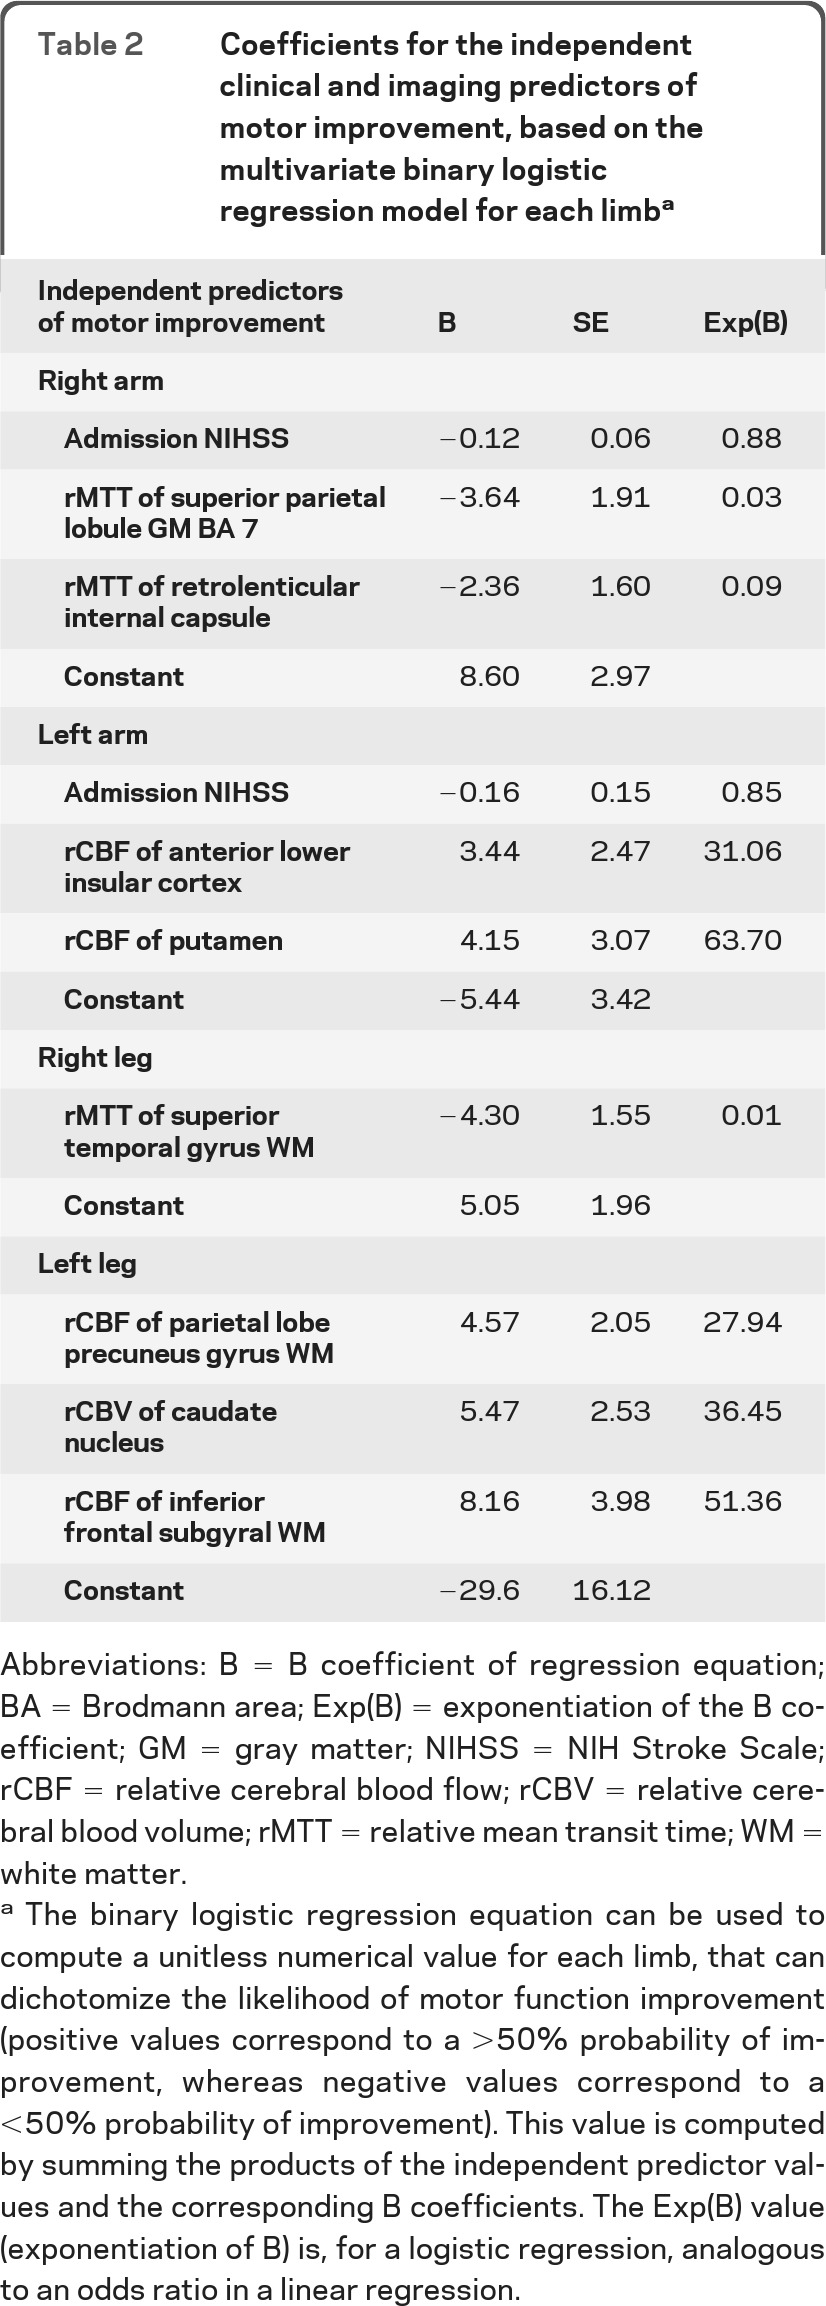
Table 2.
Coefficients for the independent clinical and imaging predictors of motor improvement, based on the multivariate binary logistic regression model for each limba

Abbreviations: B = B coefficient of regression equation; BA = Brodmann area; Exp(B) = exponentiation of the B coefficient; GM = gray matter; NIHSS = NIH Stroke Scale; rCBF = relative cerebral blood flow; rCBV = relative cerebral blood volume; rMTT = relative mean transit time; WM = white matter.
The binary logistic regression equation can be used to compute a unitless numerical value for each limb, that can dichotomize the likelihood of motor function improvement (positive values correspond to a >50% probability of improvement, whereas negative values correspond to a <50% probability of improvement). This value is computed by summing the products of the independent predictor values and the corresponding B coefficients. The Exp(B) value (exponentiation of B) is, for a logistic regression, analogous to an odds ratio in a linear regression.
