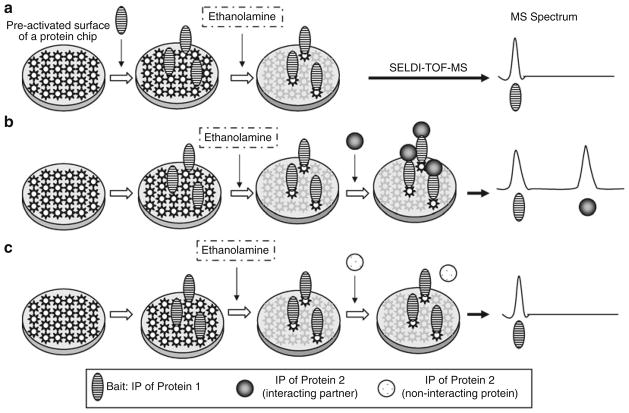
Fig. 1.
Schematic presentation of analysis of the protein–protein interaction by an ethanolamine protection on a ProteinChip array with SELDI-TOF-MS. (a ) a single peak will be detected in the mass spectrum when a single protein/peptide is immobilized onto the array surface: (b ) two peaks will be detected when the target protein/peptide specifically interacts with the bait; and (c) failure of the second peak to show up in the mass spectrum data when the protein/peptide applied subsequently does not interact with the bait protein/peptide.

