
Fig. 2.
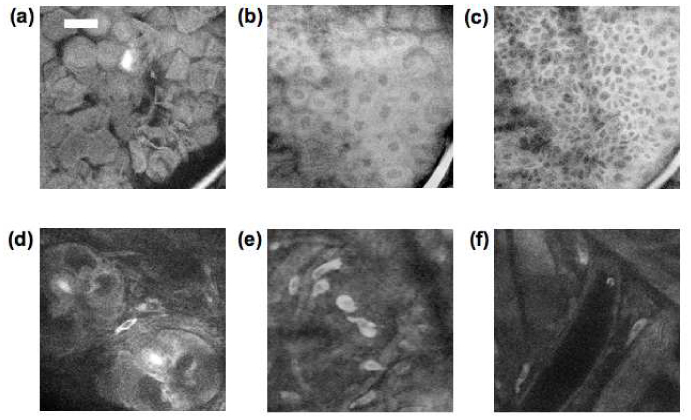
Tryptophan fluorescence images at a depth of 0, 5, 15, 30, 30, and 70 um (a-f) beneath the surface of mouse ear skin showing (a) corneocytes, (b) stratum spinosum, (c) basal cell layer, (d) hair follicles, (e) dermal cells, and (f) vascular structures. (scale bar 30 µm)