
Fig. 6.
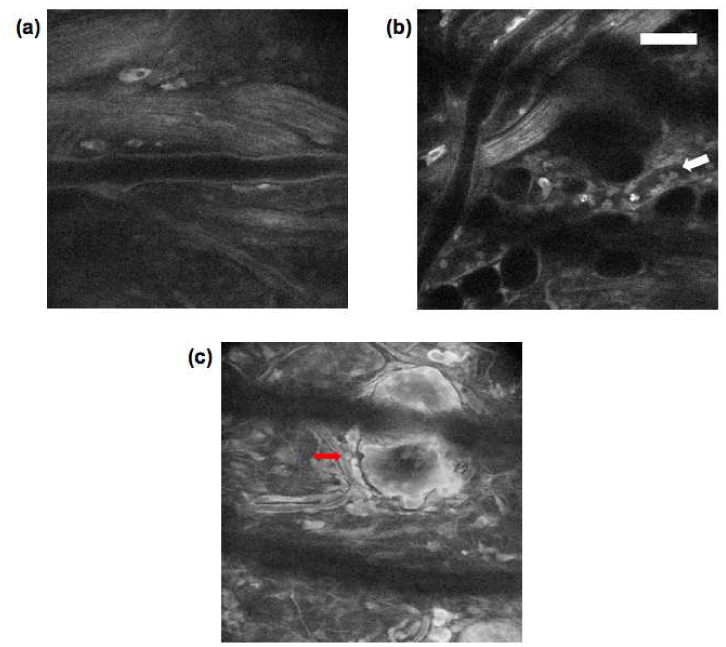
(a-c) Tryptophan fluorescence images of BALB/c mouse ear (a) 0-h, and (b & c) 24-h post LPS injection (scale bar 50 µm).
Official websites use .gov
A
.gov website belongs to an official
government organization in the United States.
Secure .gov websites use HTTPS
A lock (
) or https:// means you've safely
connected to the .gov website. Share sensitive
information only on official, secure websites.
(a-c) Tryptophan fluorescence images of BALB/c mouse ear (a) 0-h, and (b & c) 24-h post LPS injection (scale bar 50 µm).