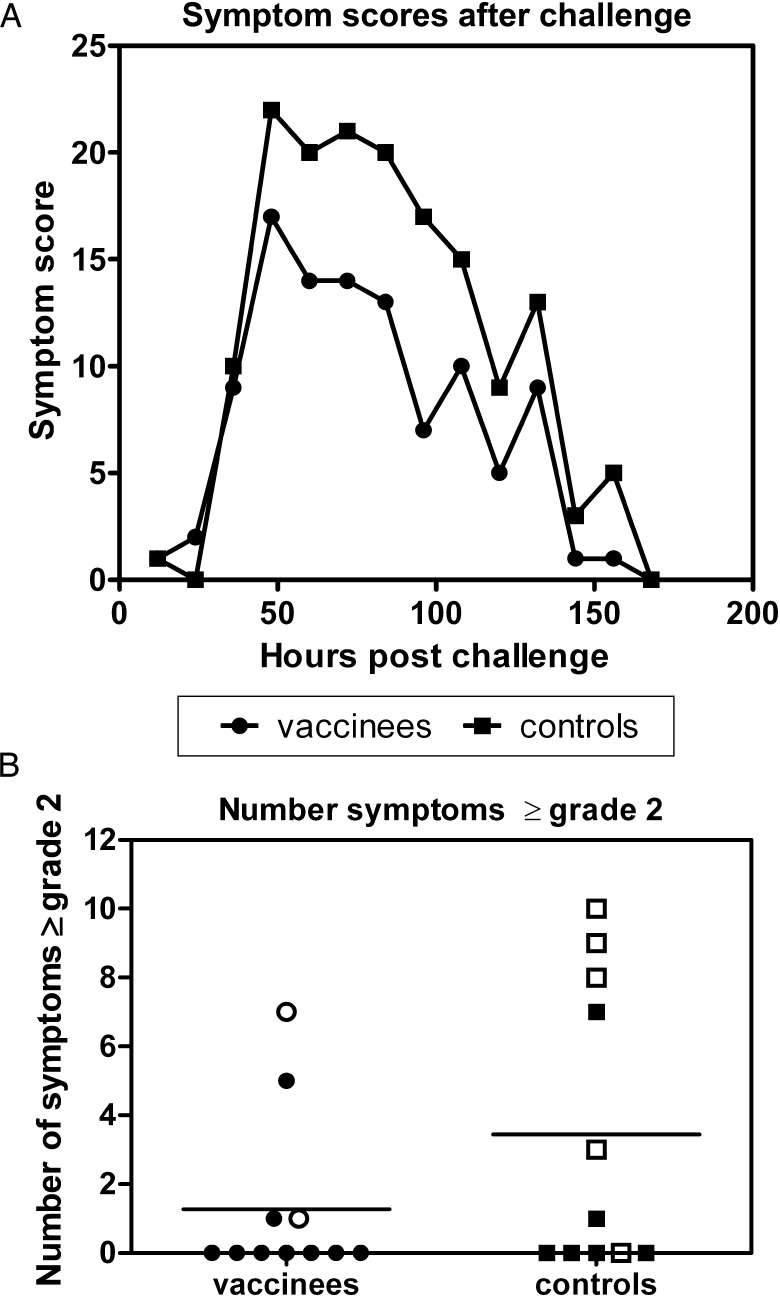
Figure 3.
Total of symptom scores at each time point following challenge (A) or total grade 2 and 3 symptom and examination scores (B) for vaccinees (circles) and controls (squares), with the group mean indicated by a line. Open symbols denote subjects who developed laboratory-confirmed influenza after challenge.

