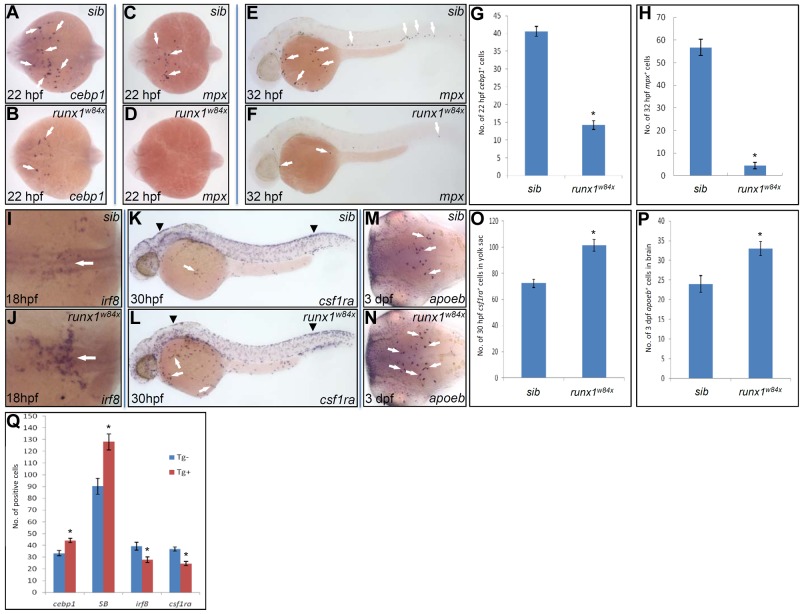
Figure 4.
Runx1 regulates embryonic neutrophil versus macrophage fate choice. (A-B) WISH of cebp1 expression in 22 hpf siblings (sib; A arrows) and runx1w84x mutants (B arrows). (C-D) WISH of mpx expression in 22 hpf sib (panel C arrows) and runx1w84x mutants (D). (A-D) Embryos are viewed dorsally with the anterior to the left. (E-F) WISH of mpx expression in 32 hpf sib (E arrows) and runx1w84x mutants (F arrows). (G) Quantification of the number of cebp1+ cells in 22 hpf sib and runx1w84x mutants. *P < .001 (t test, cebp1sib(mean/SE/n) = 40.6/1.4/54, cebp1runx1w84x = 14.2/1.3/17). (H) Quantification of the number of mpx+ cells in 32 hpf sib and runx1w84x mutants. *P < .001 (t test, mpxsib(mean/SE/n) = 56.7/3.6/30, mpxrunx1w84x = 4.5/1.4/9). (I-J) WISH of irf8 expression in 18 hpf sib (I, arrow) and runx1w84x mutants (J, arrow). Embryos are viewed dorsally with the anterior to the left. (K-L) WISH of csf1ra expression in 30 hpf sib (K) and runx1w84x mutants (L). Arrows indicate csf1ra expressed by macrophage; and arrowheads, csf1ra expressed by neural crest cells. (M-N) WISH of apoeb expression in 3 dpf sib (M arrows) and runx1w84x mutants (N arrows). Embryos are viewed dorsally with the anterior to the left. (O) Quantification of the number of csf1ra+ cells in the yolk sac of 30 hpf sib and runx1w84x mutants. *P < .001 (t test, csf1rasib(mean/SE/n) = 72.4/3.2/7, csf1rarunx1w84x = 101.5/4.5/11). (P) Quantification of the number of apoeb+ cells in the brain of 3 dpf sib and runx1w84x mutants. *P < .01 (t test, apoebsib(mean/SE/n) = 24.0/2.1/24, apoebrunx1w84x = 33.0/1.7/33). (Q) Effects of transient Runx1 overexpression on the development of cebp1+, SB+ neutrophils and irf8+, csf1ra+ macrophages. Embryos from Tg(hsp70:myc-runx1)hkz02t+/− crossed with AB WT are heat shocked at 11 hpf and fixed at 22, 36, 20, and 24 hpf for WISH detection of cebp1,SB, irf8, and csf1ra, respectively. The number of cells positive for these markers were counted and compared between Tg(hsp70:myc-runx.1)hkz02t (Tg+) and nontransgenic sibling (Tg−) embryos having undergone the same heat-shock and staining protocol. *P < .01 (t test, cebp1Tg-(mean/SE/n) = 33.4/2.4/27, cebp1Tg+ = 44.1/1.9/32; SBTg− = 90.3/6.8/17, SBTg+ = 128/6.9/15; irf8Tg− = 39.4/3.3/20; irf8Tg+ = 27.9/2.4/18; csf1raTg− = 37/1.8/22, csf1raTg+ = 24.4/1.9/22).

