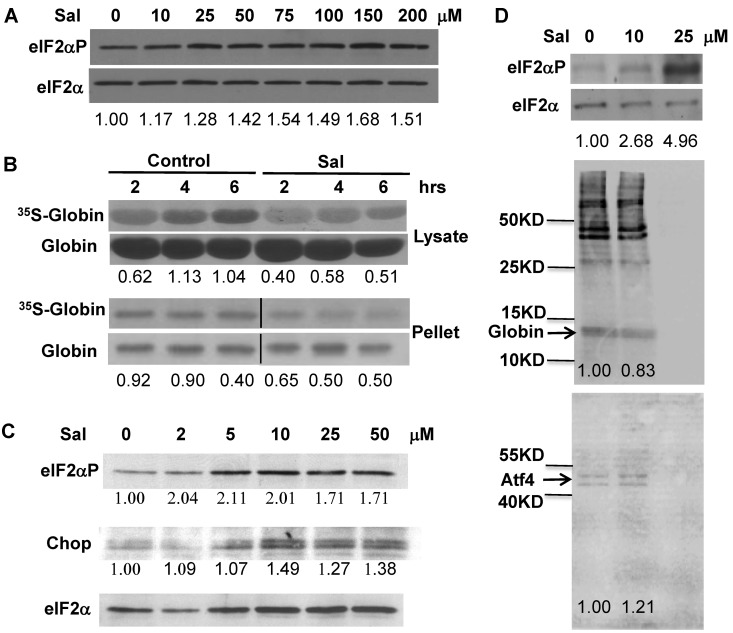
Figure 6.
Modulation of Hri signaling by salubrinal in β-thalassemic erythroid precursors. (A) eIF2αP levels in Hri+/−Hbb−/− reticulocytes. Cells were treated for 6 hours with concentrations of salubrinal indicated. (B) Globin protein synthesis in Hri+/−Hbb−/− reticulocytes. After treatment with 100μM salubrinal for 2 hours, globin protein synthesis at times indicated was measured in the supernatant and pellet fractions. Vertical lines have been inserted to indicate a repositioned gel lane. The middle lane between Control and Sal in the bottom rows (pellet), which was the salubrinal treated sample at time zero before 35S-Met/Cys labeling, was removed. (C) eIF2αP and Chop in Hri+/−Hbb−/− FL erythroid precursors. Cells were treated for 12 hours with salubrinal at concentrations indicated. Numbers in panels A and C denote the ratio of eIF2αP/ eIF2α or Chop/eIF2α. Numbers in panel B denote the ratio of 35S-globin/total globin. (D) eIF2αP levels and protein synthesis in Ter119+ cells from Hri+/+Hbb−/− spleen. Cells were treated for 3.5 hours with salubrinal as indicated, and labeled with 35S-Met/Cys for the last 3 hours. Total protein syntheses in the cell lysates are shown in the middle panel. Newly synthesized 35S-Atf4 immunoprecipitated with antibody (Abnova) is shown in bottom panel. Numbers indicate ratio of eIF2αP/eIF2α or globin and Atf4 syntheses relative to 0 μM controls.

