Fig. 6.

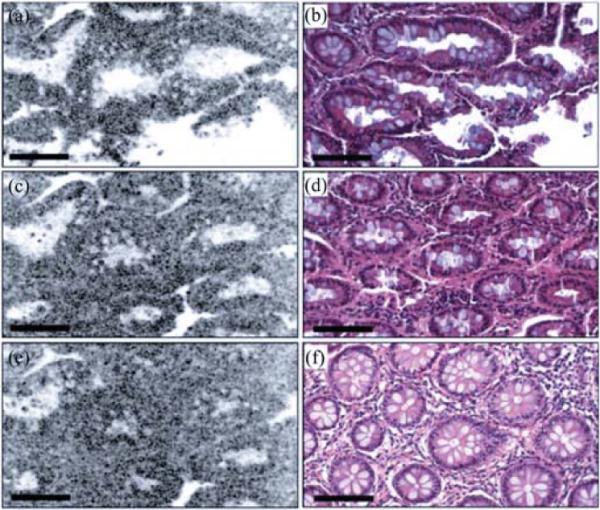
LS-OCM images (a, c, and e) and corresponding histology (b, d, and f) at different depths: 40 μm (a and b); 100 μm (c and d); 150 μm (e and f). Bar: 100 μm.

LS-OCM images (a, c, and e) and corresponding histology (b, d, and f) at different depths: 40 μm (a and b); 100 μm (c and d); 150 μm (e and f). Bar: 100 μm.