
Figure 1. Comparison of type I error rate and power for quantitative trait analysis, when the minor allele frequency (MAF) is 0.3.
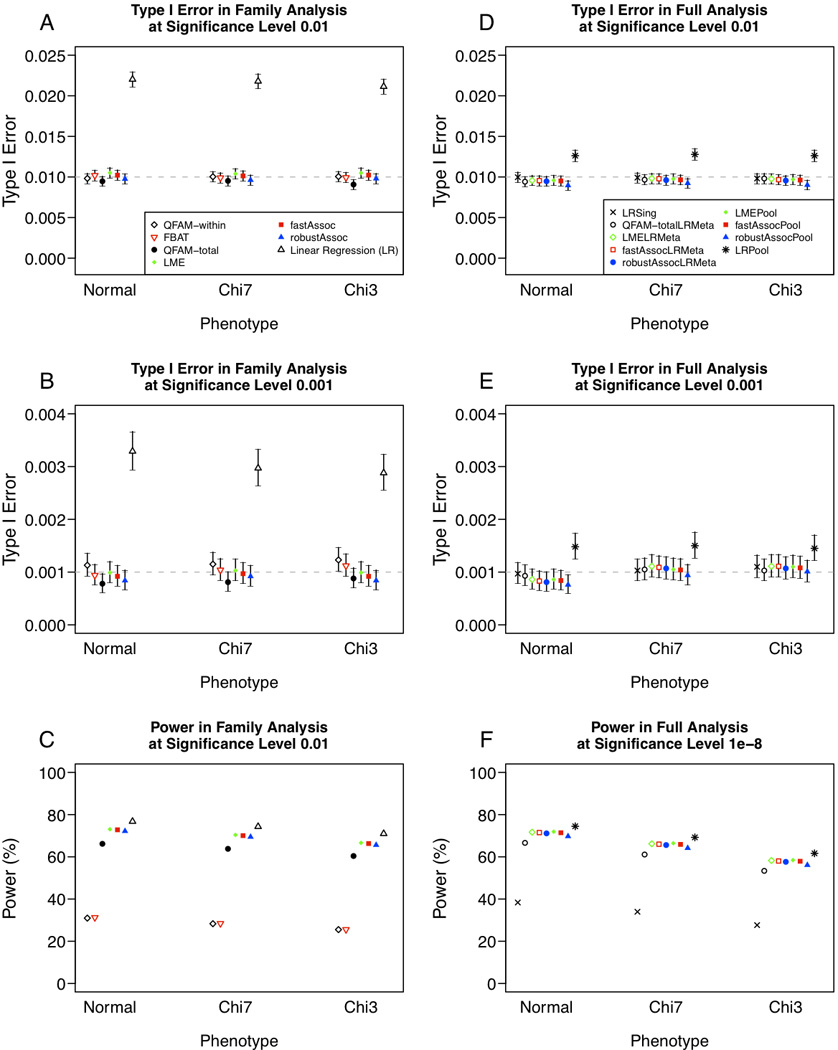
(A) Type I error rate at significance level 0.01, (B) type I error rate at significance level 0.001, and (C) power in quantitative trait analysis of 687 multiplex families. (D) Type I error rate at significance level 0.01, (E) type I error rate at significance level 0.001, and (F) power in quantitative trait analysis 687 multiplex families and 5,922 singletons, with results for analysis of 5,922 singletons alone shown for reference. Uncertainty in point estimates of type I error rates is depicted through 95% confidence intervals constructed by inverting an exact binomial test (Clopper and Pearson 1934).