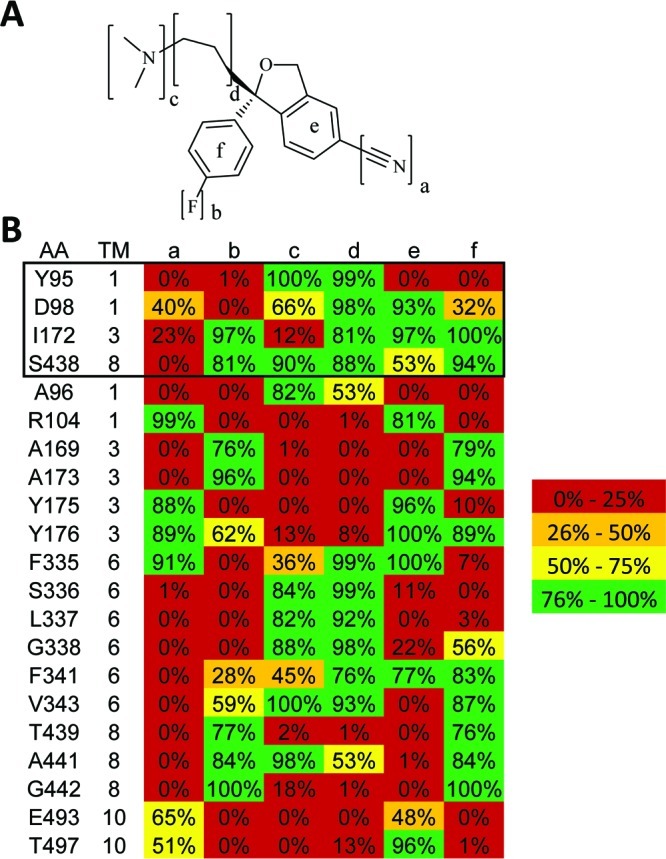
Figure 1.

(A) S-Citalopram functional groups involved in binding are labeled a−f. (B) Contacts within the S-citalopram/hSERT high-affinity binding mode are displayed as a heatmap. Given is the fraction of models that display a contact within the largest cluster of models. Residues known to affect S-citalopram binding are shown within the black box.
