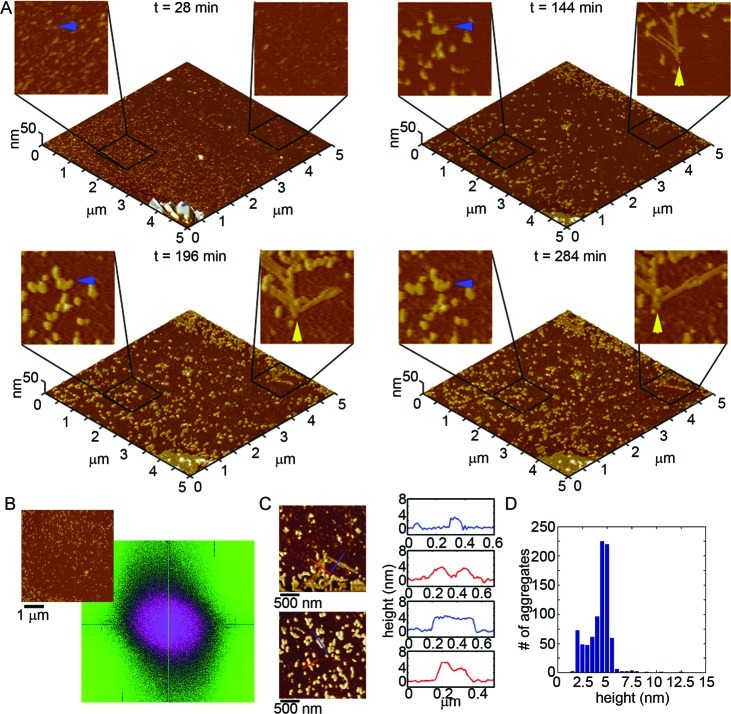
Figure 8.
Italian Aβ(1–40) forms a variety of aggregate morphologies on mica. (A) Freshly prepared Italian Aβ was imaged continuously in solution on mica at a concentration of 20 μM. 5 × 5 μm2 images are presented as 3D reconstructions with indicated zoomed in 1 × 1 μm2 areas presented in 2D. The blue arrows indicate regions where small oligomers of Italian Aβ came together to form highly curved, elongated aggregates. The yellow arrows indicate the formation of a small number of fibrillar aggregates had with a distinct morphology. (B) 2D Fourier analysis performed on a representative image (shown to the upper left) demonstrated that the majority of Italian Aβ aggregates did not display long-range order along the mica surface. (C) Height profiles of Italian Aβ aggregates on mica (corresponding to the lines indicated in the adjacent images) for the different aggregate types are shown to be ∼2.5 and ∼5 nm in height, respectively. (D) Height histograms of all aggregates after 275 min of aggregation show that, although there is a small population of ∼2.5 nm tall aggregates, the majority of Italian aggregates are ∼5 nm in height.

