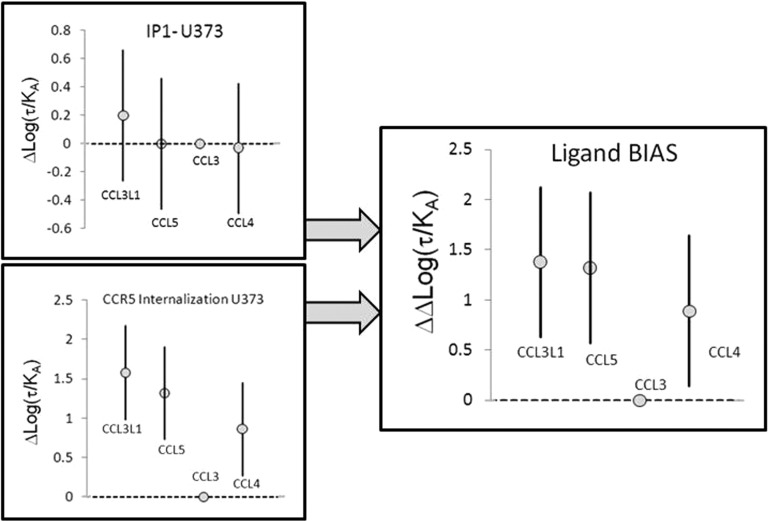
Figure 7.
Graphical representations of mean values of Δlog(τ/KA) for IP1 production and CCR5 internalization with 95% confidence intervals. These panels show that the potencies of these agonists are not statistically significantly different for IP1 production but that CCL3L1, CCL5, and CCL4 are significantly more active for producing CCR5 internalization than CCL3. The right panel shows ΔΔlog(τ/KA) values that offset the effects of system bias and compares the relative effects of the agonists on the two responses to a common reference agonist, namely CCL3. It can be seen that CCL3L1, CCL5, and CCL4 are biased at the 95% confidence level for internalization vs IP1 production in U373 cells. Bars represent 95% confidence intervals.

