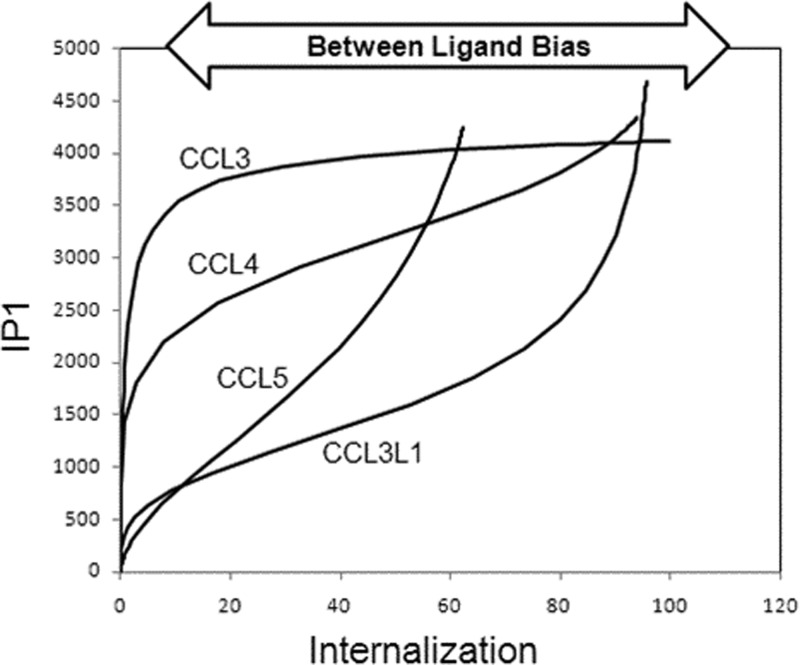
Figure 8.
Bias plot for IP1 production (ordinates) and CCR5 internalization (abscissa) for chemokines in U373 cells. Curves represent responses for the two respective pathways at equal concentrations of agonist. The divergence in the curves represents ligand bias based on receptor conformation that should be constant for all systems.

