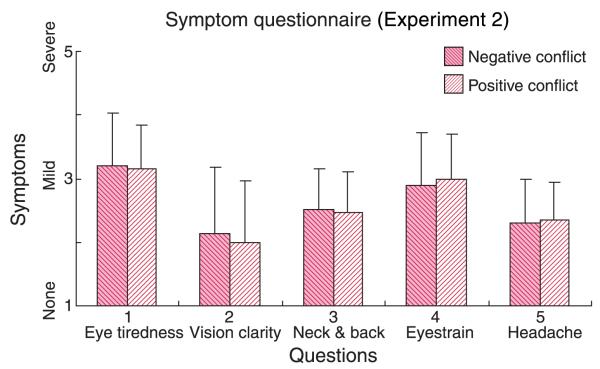
Figure 13.
The effect of direction of vergence–accommodation conflict in Experiment 2. The reported symptoms have been averaged across subjects and across distances. The red and pink bars represent the average symptoms for negative and positive conflicts, respectively, where negative conflict has a dioptric vergence distance smaller than the accommodative distance (uncrossed disparity; content behind screen) and positive conflict has a vergence distance greater than the accommodative distance (crossed disparity; content in front of screen). Error bars are one standard deviation computed across observers.

