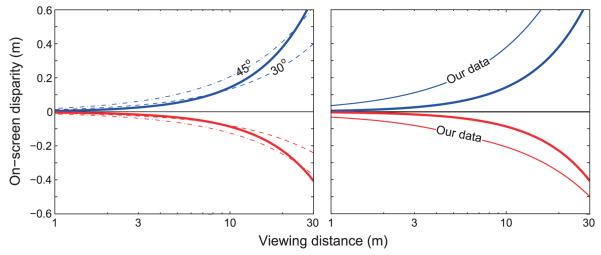
Figure 24.
The percentage rule in stereo cinematography. In both panels, the range of comfortable on-screen disparities (in meters) is plotted as a function of viewing distance (in meters). To generate the thick curves in both panels, we calculated the near disparities that are 2.5% of screen width (the average of 2% and 3%) and the far disparities that are 1.5% of screen width (the average of 1% and 2%). Those curves represent the supposed comfortable range of disparities when the viewing distance is consistent with the data of Ardito (1994) and Lund (1993). The preferred distance in centimeters is given by d = 16.5(h0.71), where h is screen height in centimeters. The dashed thin curves in the left panel represent the largest comfortable disparities according to the percentage rule when the viewing distance is a constant proportion of the screen width. Starting near the black horizontal line, the red and blue curves represent the comfortable range when viewing distance is set by maintaining a horizontal field of view of 30° (distance equals 1.9 times screen width) and 45° (1.2 times screen width). Assuming a width-to-height aspect ratio of 16:9, these correspond, respectively, to viewing distances of 3.3 and 2.2 times screen height, respectively. The thin curves in the right panel represent the largest comfortable disparities according to the data from Experiments 1 and 2 (Figure 23C).

