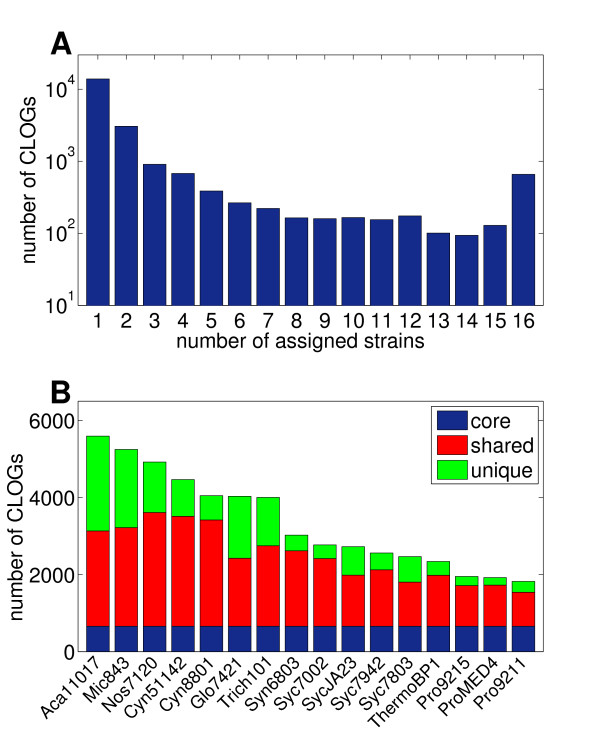
Figure 2.
Distribution of CLOGs across 16 cyanobacterial genomes. A - A histogram of the number of assigned strains to each CLOG. We distinguish between core CLOGs (660 CLOGs, assigned to all 16 strains), shared CLOGs (6668 CLOGs, assigned to 2-15 strains), and unique CLOGs (13910 CLOGs, assigned to a unique strain). B - Number of CLOGs assigned to each strain, highlighting the contribution of core, shared, and unique CLOGs.

