
Figure 8.
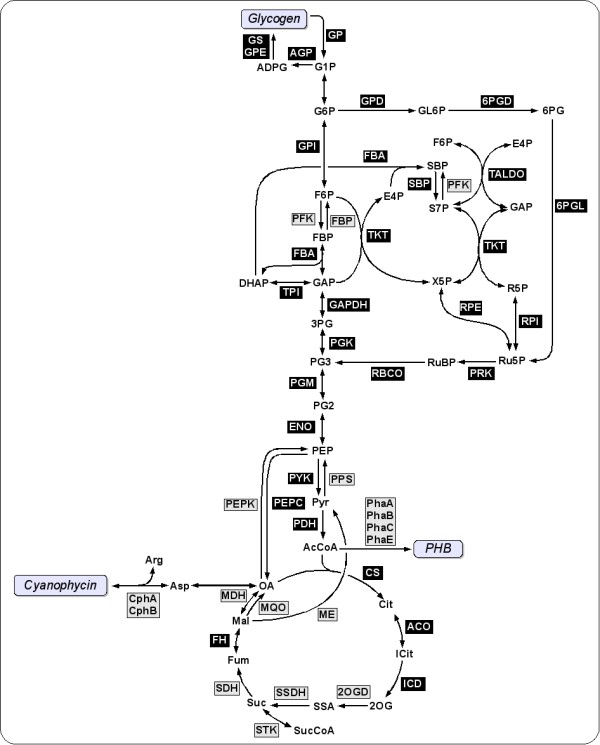
A pathway diagram of the cyanobacterial core metabolic network. Black boxes indicate enzymes whose corresponding CLOGs are associated with all 16 cyanobacterial strains. Grey boxes correspond to enzymes that are not annotated for one or more strains.