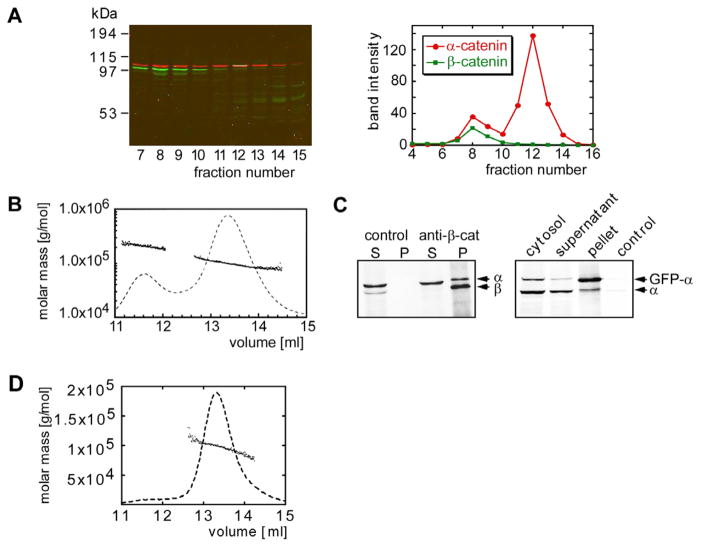
Figure 1. Oligomeric State of α-Catenin.
(A) Superdex 200 gel filtration chromatography of MDCK cell cytosol. Fractions of the gel filtration run were analyzed by SDS-PAGE and subsequent Western blotting. α-catenin (red) and β-catenin (green) were identified in the column fractions that correspond to the peak fractions of the recombinant α-catenin monomer and dimer. Band intensities of the α-catenin and β-catenin bands were plotted versus the fraction number.
(B) Molecular mass versus elution volume distribution plot obtained from a MALS experiment. The trace of the light scattering signal of the 90° angle detector is shown as a dashed line.
(C) The left-hand gel shows immunoprecipitation using anti-β-catenin antibodies of fraction 8 of the Superdex 200 gel filtration run of a MDCK cell lysate shown in (A). The supernatant and pellet were analyzed by Western blotting using anti-α-catenin and anti-β-catenin antibodies. Protein A beads with no antibody coupled were used as a control. The gel on the right shows formation of mixed dimers between GFP-α-catenin and endogenous α-catenin, as analyzed by immunoprecipitation of the cytosol fraction of MDCK cells expressing GFP-α-catenin with anti-GFP-antibody. The gel was blotted with anti-α-catenin antibody. The pellet of an immunoprecipitate using an anti-GST-antibody is shown as a control.
(D) MALS analysis of the βα-catenin molecular mass.

