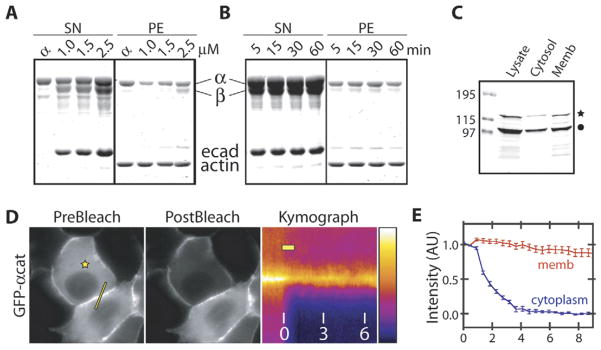
Figure 4. Exchange of α-Catenin from Cadherin-β-Catenin Complexes.
(A and B) Sedimentation of actin filaments in the presence of preassembled E-cadherin-β-catenin-α-catenin complex. Preassembled cadherin-catenin complex was isolated by gel filtration and mixed with actin filaments while varying the concentration of the complex (A) and incubation time (B) and centrifuged to sediment actin filaments and associating proteins. E-cadherin and β-catenin did not pellet above background levels. Lane α did not contain E-cadherin or β-catenin.
(C) Cellular distribution of endogenous and GFP-α-catenin following detergent extraction of MDCK cells stably expressing GFP-α-catenin. Lysates were run on SDS-PAGE and Western blotted with anti-α-catenin antibody. Endogenous and GFP-tagged α-catenin are indicated with the filled circle and star, respectively.
(D) Pre- and postbleach images and the corresponding kymograph of GFP-α-catenin at cell-cell contacts. The stars designate the location of the photo-bleaching laser spot, and lines indicate the intensity profile plotted in the kymograph. The bar in the kymograph shows the duration of photobleaching by the laser, and numbers are time in minutes. The fluorescence intensity scale is pseudocolored as shown.
(E) Time-dependent intensity profile of cytoplasmic (blue) and membrane bound (red) pools of GFP-α-catenin after FLIP as shown in (D). Data points are averages of 15 independent experiments, and the error bars represent the SEM. Time (min) is depicted on the x axis.

