Figure 4.
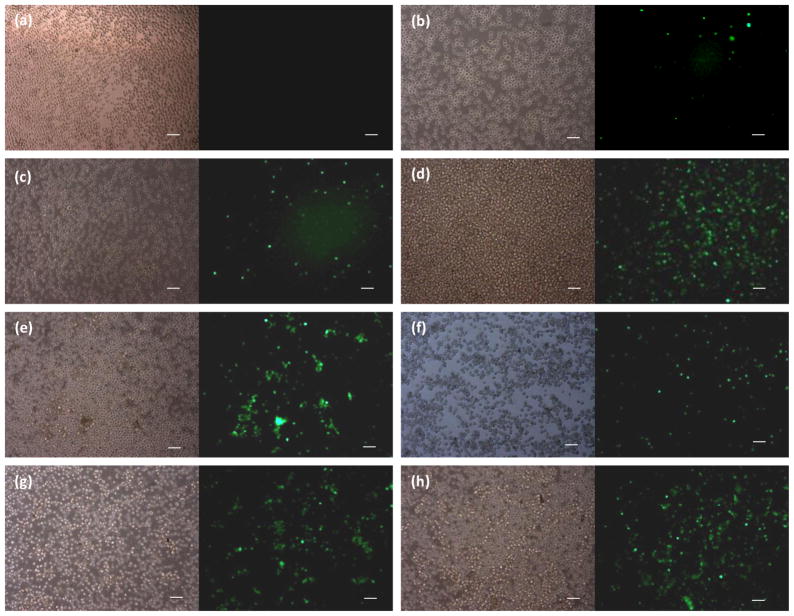
Phase contrast and fluorescence microscopic images of FITC-ODNs uptake by K562 cells, which were treated with (a) medium only (negative control); (b) free ODNs; nanotargeted FITC-ODNs encapsulated lipoplex nanoparticles, (c) non-Tf-LNs-G3139 alone, (d) non-Tf-LNs-G3139 + BE, and (e) non-Tf-LNs-G3139 + SFE; Tf-targeted FITC-ODNs encapsulated lipoplex nanoparticles, (f) Tf-LNs-G3139 alone, (g) Tf-LNs-G3139 + BE, and (h) Tf-LNs-G3139 + SFE. The FITC-ODNs concentration was set at 2 μM. BE: Bio-Rad Xcell Pulser Bulk Electorporation, 2 mm cuvette; SFE: semi-continuous flow electroporation. Electroporation conditions: unipolar square wave pulses with a pulse duration of 25 ms for both BE and SFE. The scale bars represent 100 μm.

