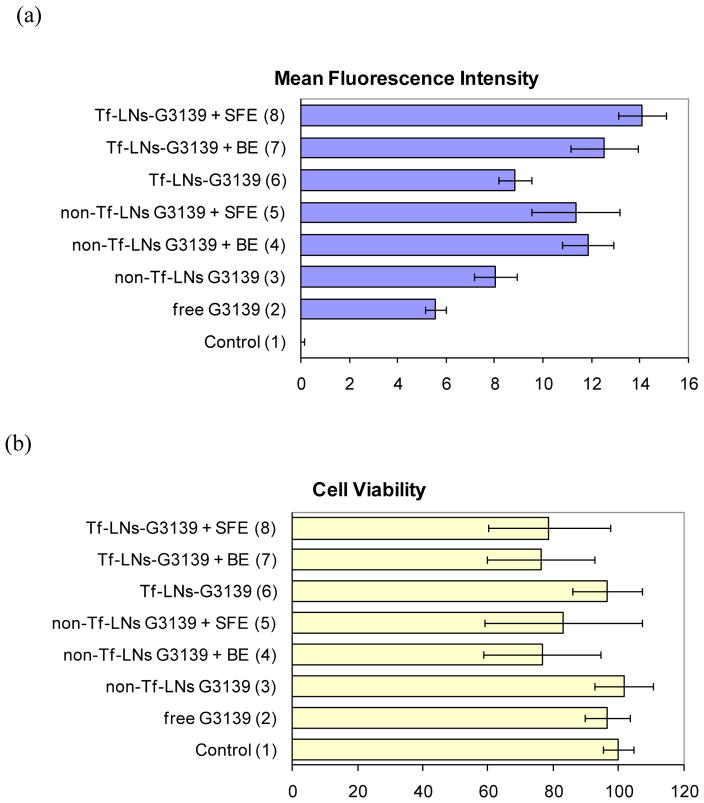
Figure 5.
Quantitatively analysis of the ODN delivery efficiency in K562 cells via flow cytometry (a) and the cell viability via MTS assay (b). The FITC-ODNs concentration was set at 2 μM. The error bars correspond to triplicate experiments made with independently produced batches of lipoplex nanoparticles. Electroporation conditions: unipolar square wave pulses with a pulse duration of 25 ms in both BE and SFE.

