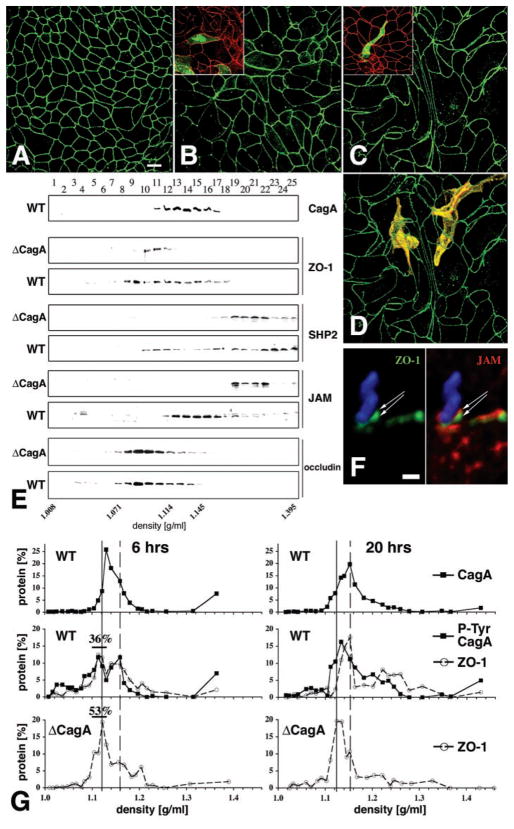
Fig. 4.
Effects of H. pylori infection on MDCK morphology and molecular organization of the apical-junctional complex. [(A) to (D)] Confluent monolayers of MDCK cells were infected with either nonadherent H. pylori (A), ΔcagA (B), or wild-type H. pylori (C) in continuous coculture for 7 days. Confocal immunofluorescence imaging of ZO-1 with an antibody to ZO-1 (green) outlines the shape of cell borders. (D) Optical sections of phalloidin staining (yellow) of actin were used to reconstruct the 3D shape of two cells within the monolayer infected with wild-type H. pylori. Similar experiments were done on a mixture of normal and GFP-expressing MDCK cells [insets in (B) and (C)]. Cells infected for 1 day with either wild-type [(C) inset] or ΔcagA [(B) inset] H. pylori were stained with anti–ZO-1 antibodies (red). The shape of single cells within the monolayer is revealed by GFP (green). (E) Membrane fractionation using 10–20–30% step iodixanol gradients. MDCK monolayers were infected for 5 days with wild-type or ΔcagA H. pylori. Twenty-five fractions of increasing density were separated by SDS-PAGE and the presence of CagA, ZO-1, SHP2, JAM, and occludin was determined by Western blot with appropriate antibodies. (F) Confocal immunofluorescence 3D reconstruction of an H. pylori (blue) adhered to the AGS cell surface for 4 hours and stained with antibodies to ZO-1 (green) and JAM (red). (G) Quantitative protein analysis of membrane fractions from MDCK cells during synchronized junction assembly. Bacteria and calcium were added simultaneously to noncontacting cells and incubated for 6 or 20 hours. Membrane fractions separated by density were subjected to SDS-PAGE and analyzed by Western blot for CagA, ZO-1, and phosphotyrosine. Protein distribution is plotted as the percentage of total signal for each protein. Percentages of ZO-1 at 6 hours represent the sum of protein signals between 1.104 and 1.130 g/ml (black bars). Solid line, lighter peak; dashed line, denser peak.

