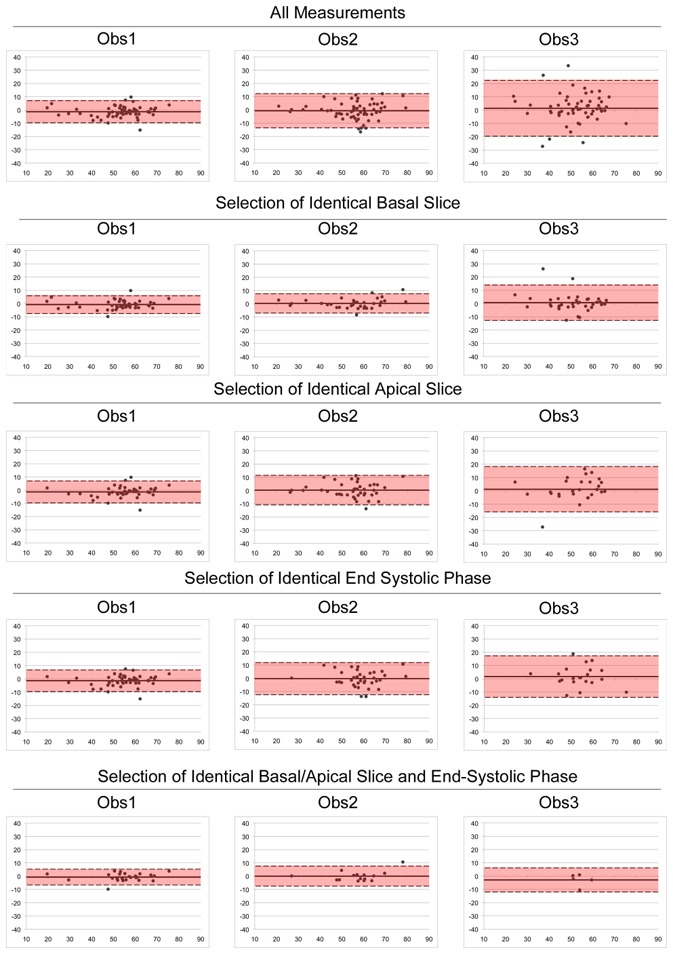
Figure 4. Bland Altman plots: effect of processing steps on intra-observer variability for RV functional parameters.

x axis = average of the 2 measurements of the observer; y axis = differences between the 2 measurements of the observer.

x axis = average of the 2 measurements of the observer; y axis = differences between the 2 measurements of the observer.