
Figure 4. Microarray analysis of WT and KO mice.
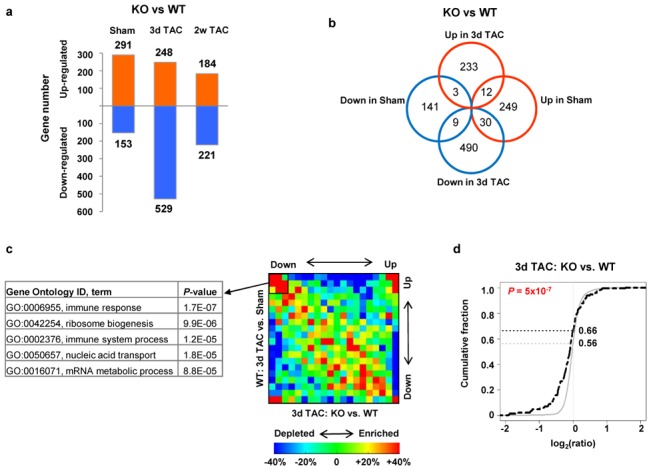
A. Number of genes differentially regulated between KO versus WT in sham, and after 3 days and 2 weeks TAC. B. Venn diagram showing differences of regulated genes between KO and WT in sham and 3 days TAC. C. Gene ontology categories, corresponding to genes with lower expression in KO versus WT 3 days after TAC, are indicated. The gene density map reflects distribution of genes, with color corresponding to the scale shown in the Figure. For example, “+40%” and “−40%”, shown as red and blue indicate 40% enrichment and 40% depletion, respectively. D. Expression changes of STAT3-regulated genes in Hsp22 KO 3 days after TAC. STAT3-annotated genes were compared to other genes on the microarray using the cumulative distribution function (CDF) based on log2 ratio (fold change). The black dotted curve is for STAT3-regulated genes, and the grey curve for other genes. For each curve, the fraction of genes at which log2(ratio)=0 is indicated. The P value indicating the difference between both curves is calculated from the Kolmogorov-Smirnov test.