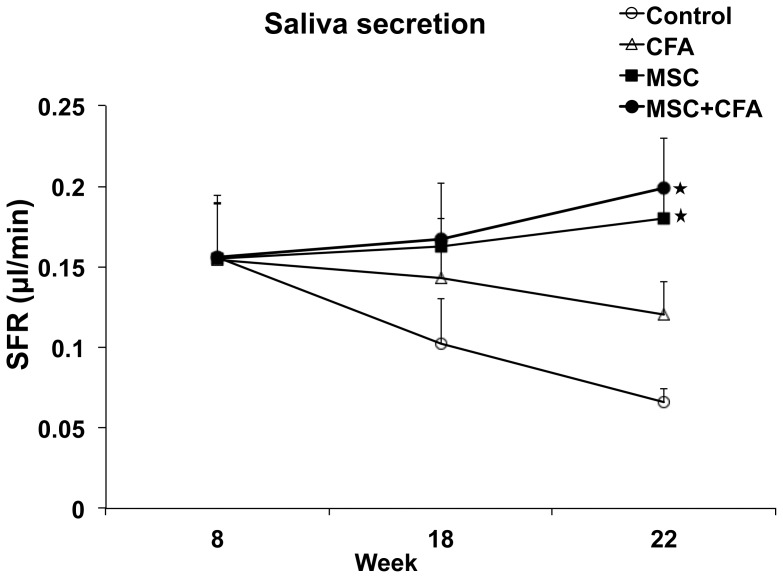
Figure 1. Salivary flow rates (SFRs) of NOD mice.
SFRs in MSC+CFA (black circle; n = 10) and MSC (black square; n = 5) groups did not decrease during the follow-up period (22 wk of age) and were significantly higher than SFRs of CFA-treated or control NOD groups (n = 5 per group; P<0.05). SFRs in CFA (triangular) or control (untreated; open circle) groups continued to decrease during the follow-up period (* P<0.05).

