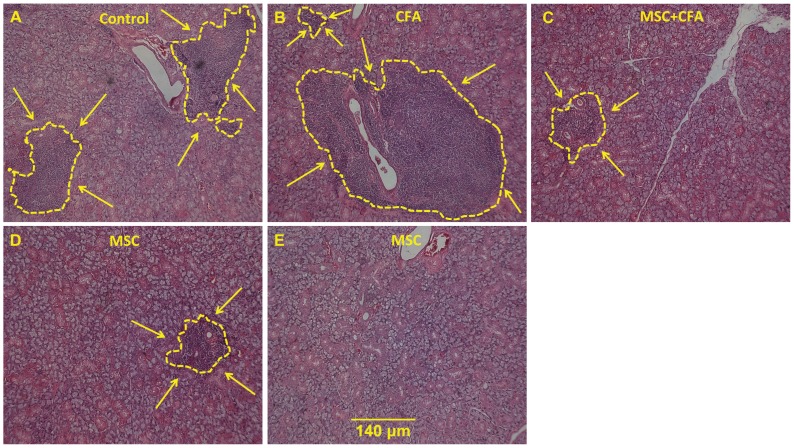
Figure 2. Infiltrate of lymphocytes in salivary glands of NOD mice.
A–E: H&E staining showing size of the lymphocytic infiltrations (delineated with a yellow line and arrows) in NOD that were untreated (A), CFA-treated (B), MSC+CFA (C), MSC cells (D). In 2 of the 5 NOD mice transplanted with MSC only, no lymphocytic infiltrates were noted (E). Scale bar: 140 um for all images. F: Graph showing distribution of focus score (n = 5 to 9 mice per group). The mean focus score was significantly higher in control (3.24) versus CFA (1.81), MSC (1.23), and MSC+CFA (1.8) NOD groups (* P = 0.02).

