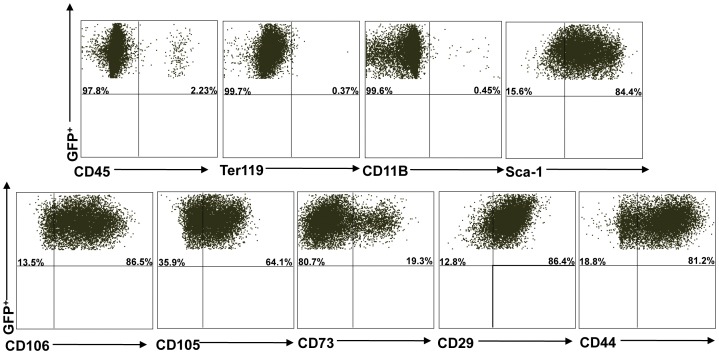
Figure 6. Flow cytometry analysis of CD45−/Ter119− cells.
After 3 passages, CD45−/Ter119− cells were stained with the following surface markers: CD45, Ter119, CD11B, Sca-1, CD106, CD105, CD73, CD29 and CD44. Data are representative of at least three separate experiments. This experiment shows 97.8% CD45−, 99.7% TER119−, 99.6% CD11b− and 84.4% Sca1+, 86.5% CD106+, 64.1% CD105+, 19.3% CD73+, 86.4% CD29+, 81.2% CD44+ cells.

