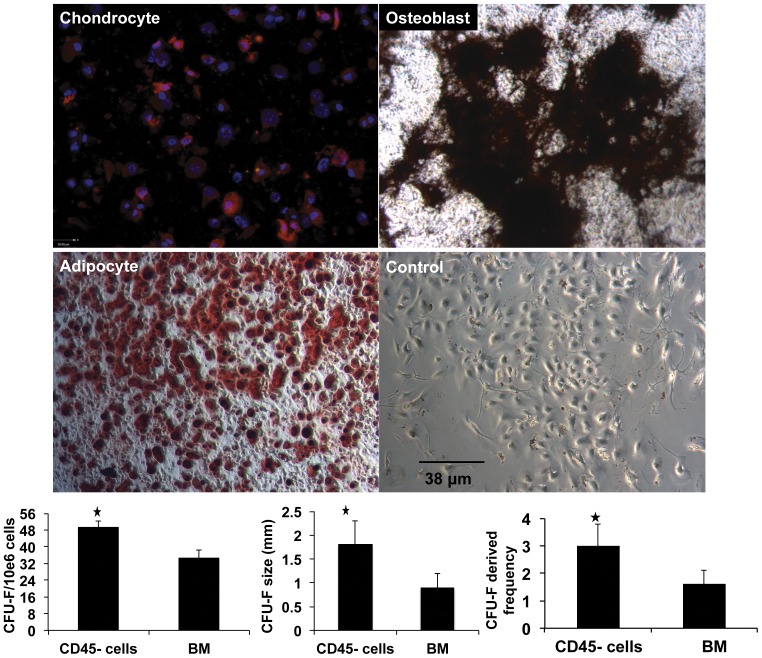
Figure 7. Functional assays for multipotent mesenchymal stromal cell (MSCs).
Photomicrographs of CD45−/TER119− cells that undergone chondrocytic, osteogenic and adipocytic differentiation when cultured in differentiation media. Lower right photomicrograph represents CD45−/TER119− cells cultured in non-differentiating media (negative control). Collagen II (red) and DAPI (blue nuclei) are used to identify chondrocytes. Von kossa (black) and oil red stainings were used to identify osteoblasts and adipocytes, respectively. Graphs represent the number, size, and frequency of colony-forming unit fibroblasts (CFU-F) of CD45−/TER119− cells versus whole bone marrow cells. All three graphs show that CD45−/TER119− cells had higher CFU-F than whole bone marrow cells (* P<0.05).

