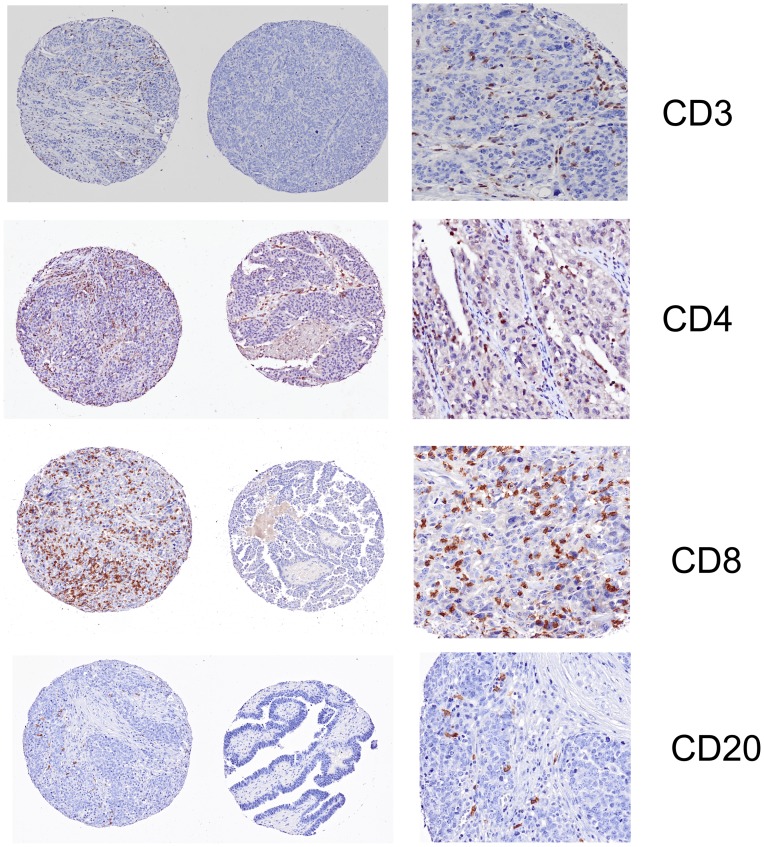
Figure 3. Representative staining for immunohistochemistry of tumor infiltrating lymphocytes.
High and low density of CD3+ (T cells), CD4+ (T cells), CD8+ (T cells) and CD20+ (B cells) shown in left and middle panels. A magnification in the high infiltration area is shown on the right panel for each staining.

