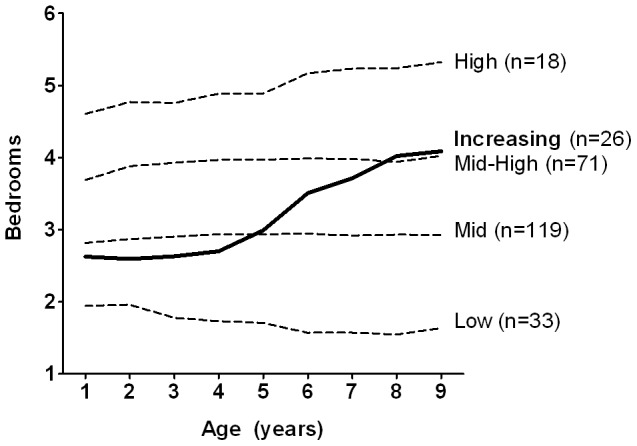
Figure 1. Childhood SES trajectories.

SES trajectories were derived from parent-reported housing data (number of bedrooms in the family home, for each year of the child's life). Individual children were assigned to trajectory groups using a semiparametric, group-based statistical modeling strategy; the number of children in each group is shown. Plotted lines represent the average trajectory for each group. SES, socioeconomic status.
