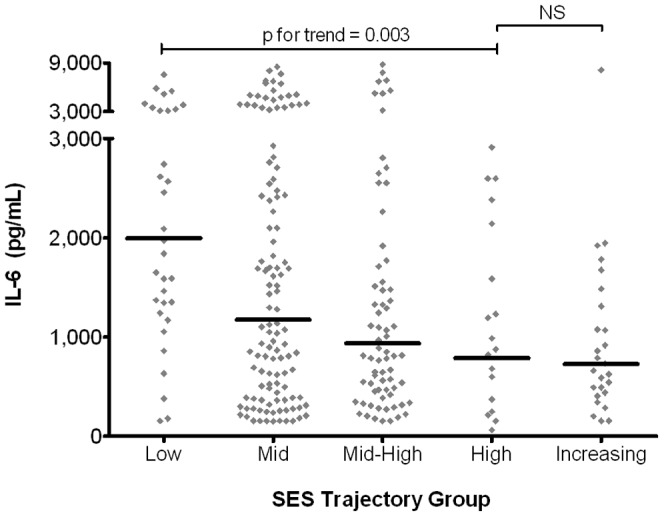
Figure 2. IL-6 responses by SES trajectory group.

IL-6 responses were measured in LPS-stimulated PBMC by ELISA; children were assigned to SES trajectory groups as depicted in Figure 1. Data points represent individual children; bars represent geometric means. Log-normalized values compared by ANOVA with post-testing for linear trend and multiple comparisons. ELISA, enzyme-linked immunosorbent assay; LPS, lipopolysachharide; PBMC, peripheral blood mononuclear cells; SES, socioeconomic status.
