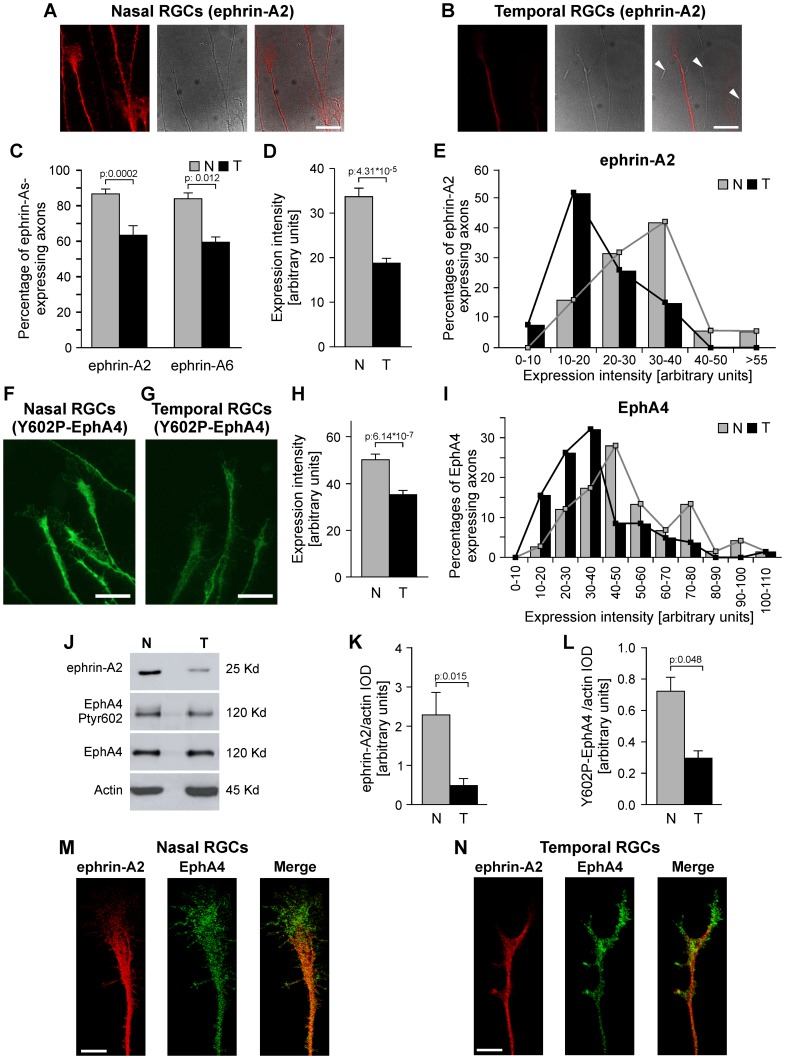
Figure 2. Ephrin-A2 and –A6 expression and EphA4 Tyr-602 phosphorylation decrease from nasal to temporal RGCs.
(A–E) Expression gradients of ephrin-A2 and –A6 depend upon the level of expression of each RGC and the proportion of RGCs that express them. (A, B) Immunofluorescence against ephrin-A2 (left), phase-contrast (middle) and merge (right) of RGC axons grown during 24 hours from E7 nasal (A) and temporal (B) retinal explants are shown. Expression intensity and proportion of labeled axons are higher in nasal explants. Negative axons are depicted (arrowheads) in temporal explants. Scale bars = 10 µm. (C) Quantification shows that a higher proportion of nasal axons express ephrin-A2 and –A6 (Student's t test, ephrin-A2: 4 independent experiments, 557 nasal and 733 temporal axons; ephrin-A6: 2 independent experiments, 326 nasal and 181 temporal axons). (D) Quantification of fluorescent intensity measured as integral optic density (IOD) in axons of nasal and temporal explants immunolabeled against ephrin-A2 shows that nasal axons present higher levels of expression (Mann Whitney test, 3 independent experiments, n: 52 nasal and 49 temporal axons). (E) Histogram of fluorescent intensity of one experiment shows that nasal and temporal axons form two partially overlapping populations where the major proportion of nasal axons presents higher levels of intensity than the major proportion of temporal axons. Similar results were obtained in the other experiments. (F, G) Immunofluorescence against Tyr-602 phosphorylated-EphA4 in nasal (F) and temporal (G) retinal explants are shown. Expression is higher in nasal axons. Scale bars = 10 µm. (H) IOD is significantly higher in nasal axons (Mann Whitney test, 3 independent experiments, n: 75 nasal and 84 temporal axons). I. Histogram of fluorescent intensity shows that nasal and temporal axons form two partially overlapping populations where the major proportion of nasal axons presents higher levels of intensity than the major proportion of temporal axons. Similar results were obtained in the other experiments. (J) Western blot analysis against ephrin-A2, Tyr-602-phosphorylated-EphA4 and EphA4 of crude membrane fractions obtained from nasal and temporal retinas at E8. (K, L) Quantification of ephrin-A2/actin (K) and Tyr-602-phosphorylated-EphA4/actin ratios (L) from 3 similar experiments shows that nasal retina presents significantly higher levels of ephrin-A2 and Tyr-602-phosphorylated-EphA4 (Student's t test). (M, N) Confocal microphotographs of nasal (M) and temporal (N) axons grown from retinal explants immunolabeled against ephrin-A2 (red) and EphA4 (green) are shown. Right images are the merges. They show that there are more patches of overlapping (yellow) in the nasal axonal shaft and growth cone than in the temporal ones. Scale bars = 5 µm. (Pearson's correlation coefficient: 0.62+/−0.011 versus 0.55+/−0.008, p: 0.045; Manders overlap coefficient: 0.82+/−0.002 versus 0.75+/−0.001, p: 9.56*10−6, 2 independent experiments; n: nasal RGCs: 30 axons, temporal RGCs: 26). Results are shown as mean +/− SE,. Nasal RGC axons (N), temporal RGC axons (T).

