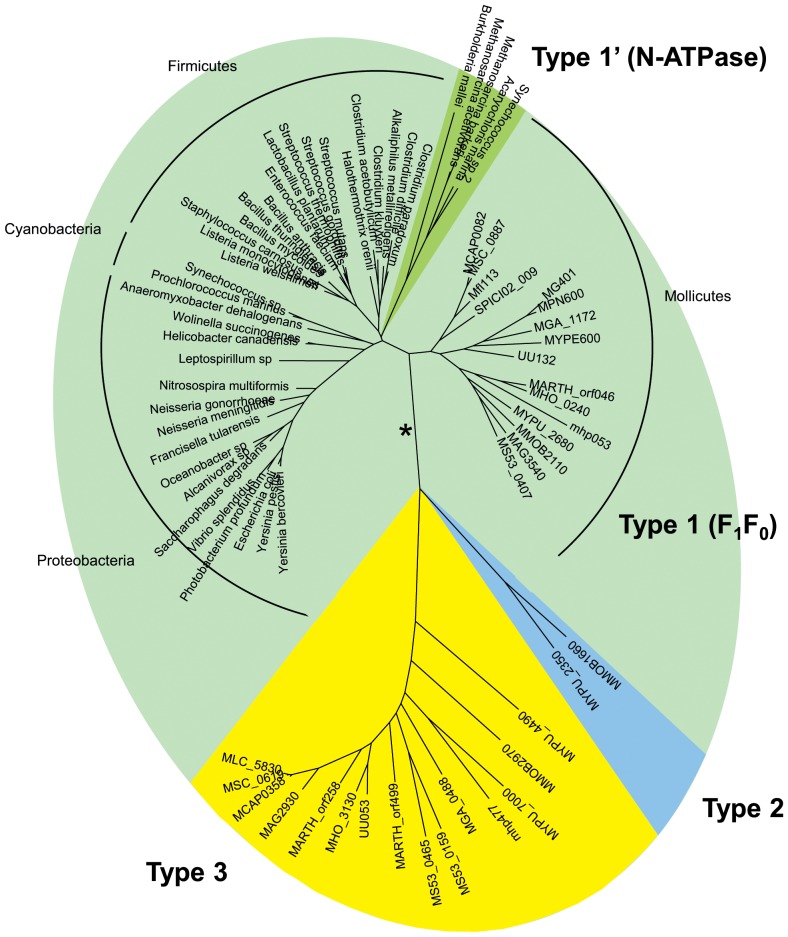
Figure 3. Evolution of atpA and atpA-like genes in bacteria.
The phylogenetic tree was inferred from the amino acid sequences of ATPase alpha subunits encoded by atpA and atpA-like genes. Multiple alignment was generated with MUSCLE. The phylogenetic tree was generated by the ML method. Branches corresponding to Type 1, Type 1′, Type 2 and Type 3 proteins were supported by 96–100% bootstrap values. The ML, NJ, MP and ME methods generated trees with similar topologies, except alternative branching of N-ATPases using NJ or ME (indicated by a star). Main bacterial groups are indicated. Proteins from mollicutes are named by their mnemonics, others by the species name. See Table S2 for details.

