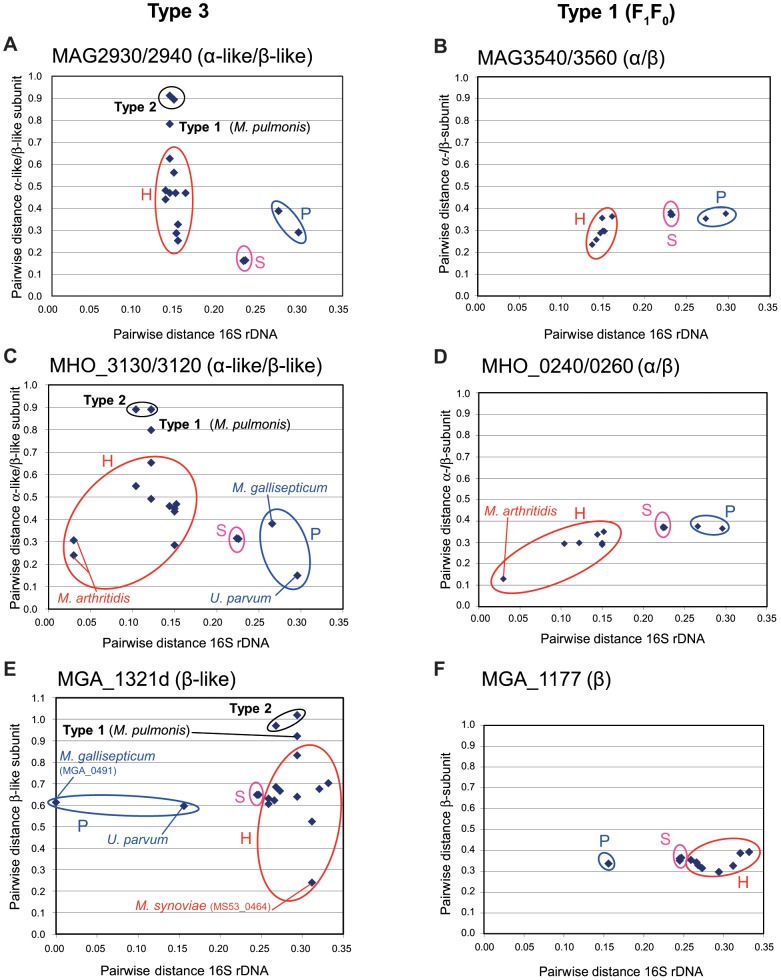
Figure 4. Evolutionary distance between clusters.
Amino acid sequences of genes encoding α-like and β-like proteins of the Type 2 and Type 3 clusters (panels A, C and E) and α- and β-subunits of F1F0 Type 1 clusters (panels B, D and F) were concatenated and multiple alignments were generated. Multiple sequence alignments were curated with GBLOCK to remove unreliable sites and a final round of manual editing was performed with Jalview. Evolutionary distances were calculated with Type 3 pairs thought to have been exchanged through HGT as references. These distances are shown as a function of the evolutionary distance between species inferred from 16S rDNA data. The Type 3 pairs concerned were MAG2930/2940 (M. agalactiae), MHO_3130/3120 (M. hominis) and MGA_1321d (M. gallisepticum). In the last case, the analysis was based exclusively on the truncated atpD-like gene. Homologs from a phylogenetic group are circled: H, Hominis; P, Pneumoniae; S, Spiroplasma.

