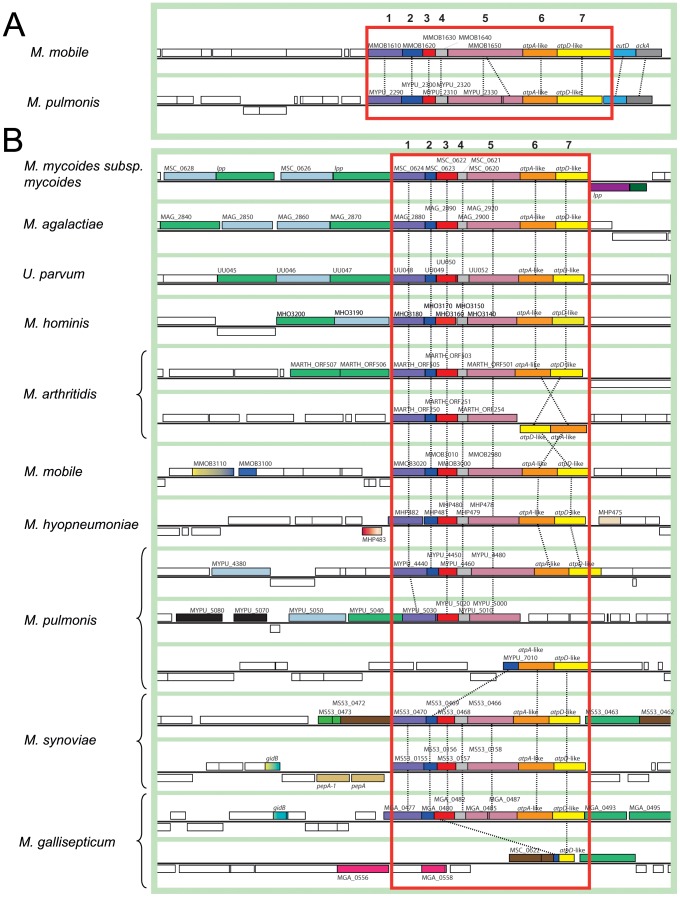
Figure 5. Genomic contexts of Type 2 and Type 3 clusters in mycoplasmas.
Homologous genes are indicated by boxes of the same colour, connected by dashed lines. The genomic regions containing the Type 2 (A) and Type 3 (B) clusters are framed in red. The schematic diagram was generated from screenshots obtained from the MBGD database. Mnemonics and gene names are indicated; genes from the clusters are numbered arbitrarily from 1 to 7. The genome structures of M. mycoides subsp. capri and M. capricolum subsp. capricolum were identical to that of Mmm.

