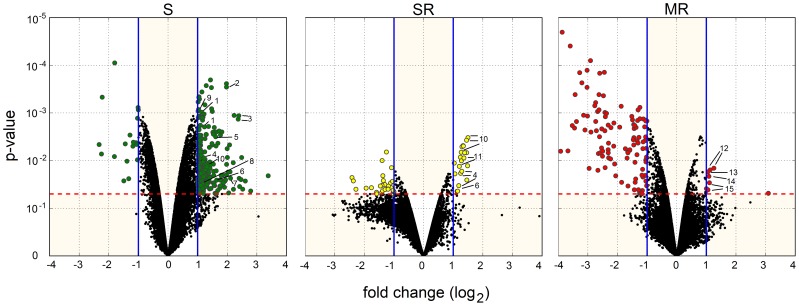
Figure 1. Transcriptional responses in three Myzus persicae genotypes (S, SR and MR) subjected to a pirimicarb.
Volcano plots for each genotype show the log2 fold change (x axis) and the statistical significance (y axis) between the controls and treatments. Vertical lines indicate 2-fold expression difference in either direction (−1>log2FC>1). Horizontal line indicates significance threshold (P<0.05). Statistical analysis is based on a Bayesian inference using a lineal model, and reflects both biological and technical replications. Genes showing both 2-fold differential expression and a significant P value are colored. Not all labels appear in the S, SR and MR volcano plot in order to preserve readability (see Table 2 and supporting material for a full listing of significantly over-expressed genes). Gene abbreviations: 1, glutathione s-transferase; 2, cytochrome p450 family CYP6CYP3; 3, carboxylesterase type FE4; 4, cathepsin b; 5, cytochrome p450 family CYP6; 6, cuticle protein; 7, salivary peptide; 8, ABC transporter; 9, glucose transporter; 10, cytochrome p450; 11, heat shock protein 70; 12, heterotrimeric guanine nucleotide-binding protein; 13, histone h3 methyltransferase, 14, eukaryotic initiation factor; 15, unknown protein.

