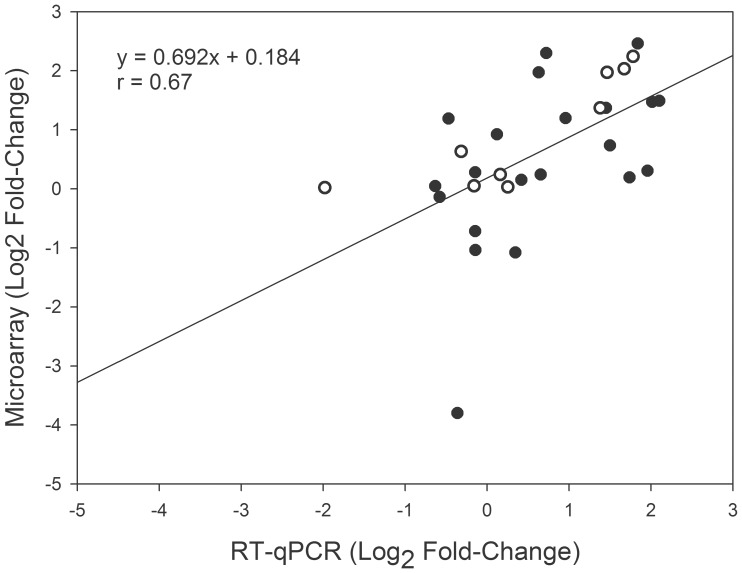
Figure 2. Correlation of gene expression changes measured using DNA microarray analysis and quantitative reverse transcription PCR (RT-qPCR).
The average log2 fold-change values were used, and each point represents the gene expression in a genotype. Open circles correspond to expression using in RT-qPCR the same RNA samples as were used for microarray experiments. Black circles correspond to expression in RT-qPCR experiments using RNA that was obtained from new biological replicates. Spearman correlation coefficient (r) is shown in the graph.

