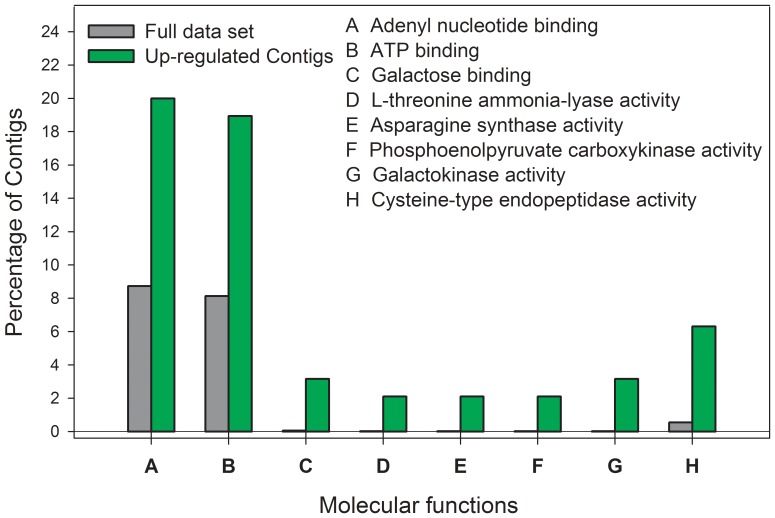
Figure 5. Molecular functions over-represented in the sensitive genotype (S) after an Enrichment Analysis.
The bars show the percentage of contigs associated with each GO term. The dark gray show the percentage of contigs associated with each GO term considering the full microarray data set. Green bars show the percentage of contigs associated with each GO term but only in the up-regulated date set.

