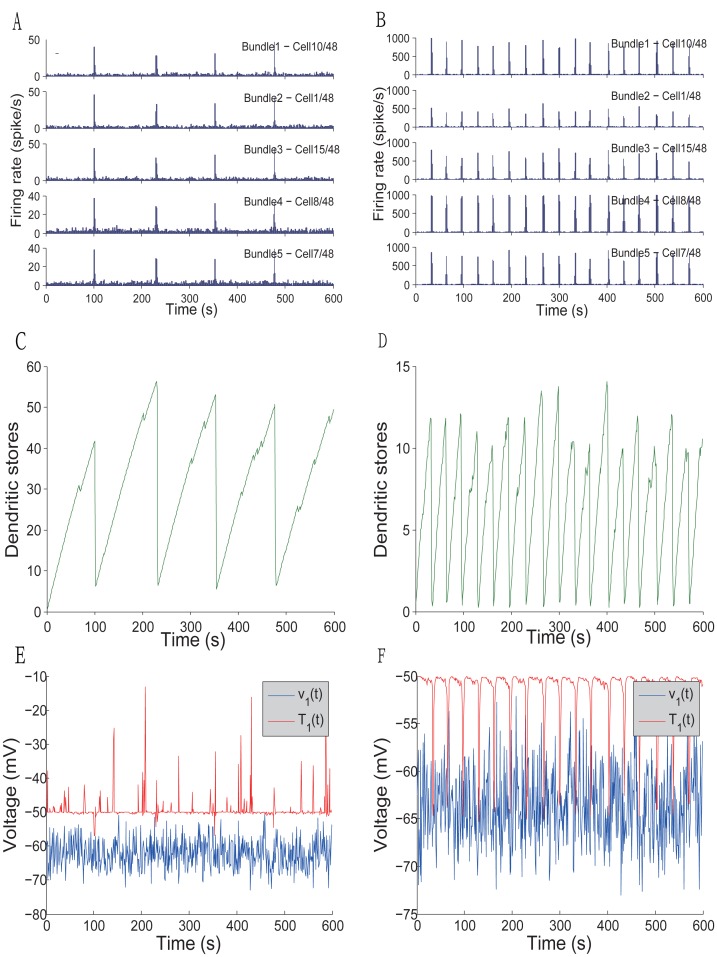
Figure 2. Transition between spiking and bursting in the ONN with  Hz (left column) and in the SNN with
  Hz (right column).
Both networks are composed of 48 neurons and 12 bundles. (A,B) Ratemeter records of 5 representative cells with time span of 600 s. (C,D) Records of the oxytocin store level of cell 1. (E,F) Voltage trace(blue) and spiking threshold(red) of cell 1. Note that bursting events are essentially attributed to the drop of the spiking threshold and store level.

