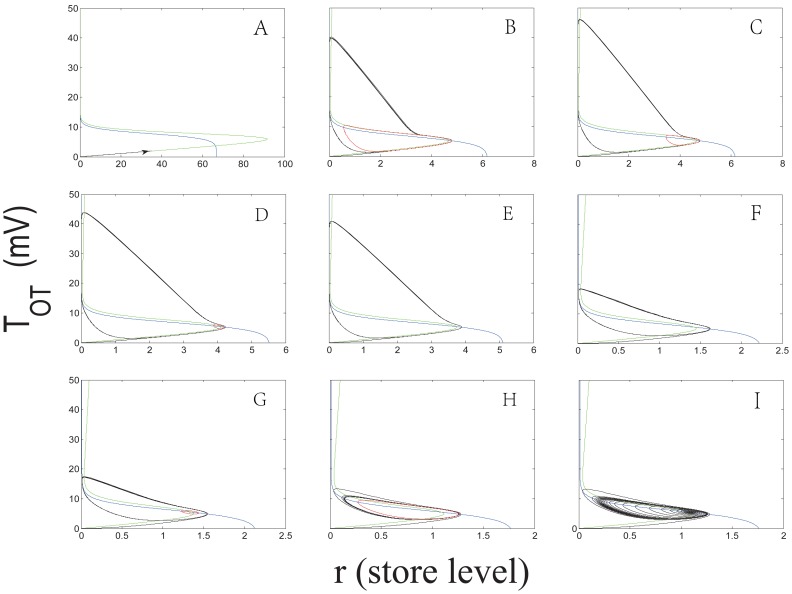
Figure 5. Phase portraits of the system (8) with  and varied
  : (A)
: (A)  Hz; (B)
  Hz; (C)
  Hz; (D)
  Hz; (E)
  Hz; (F)
  Hz; (G)
  Hz; (H)
  Hz; (I)
  Hz.
Hz.
The  -nullcline and
  -nullcline are colored in blue and green respectively. The red circles represent the unstable limit cycles, and the black curves stand for the orbits with the initial point
  .
.

