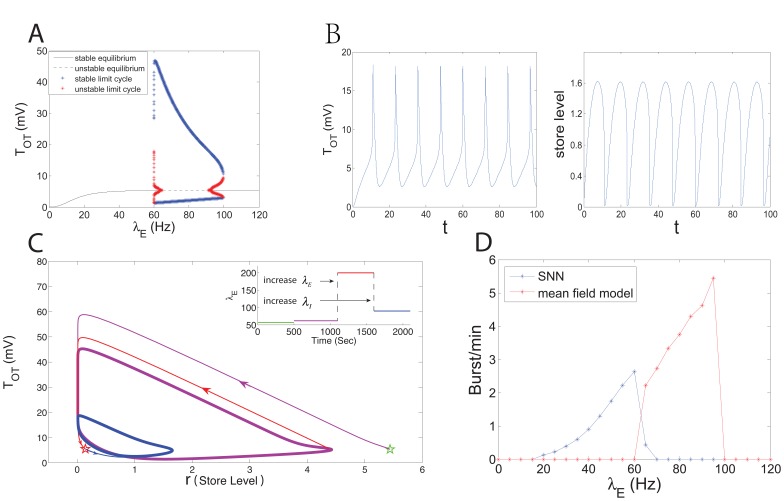
Figure 7. The bifurcation behaviors in the mean field model.
(A) Bifurcation diagram with  and with the variation of
  . Here, the asymptotical dynamics of the
  -component are taken into account. The black line and the dash line represent the stable and the unstable fixed points, respectively. For each
  , the blue and the red dots represent the eventually upper-and-lower boundaries of the stable and the unstable limit cycles in the
  -component. (B) The trajectories of the system (8) when
  Hz and
  (see also the phase orbit in Fig. 5F). The sharp peaks in the left plot and the sharp valleys in the right plot reflect the characteristics of the slow-fast dynamical system. (C) The bifurcation transition regulated by the input rate
  with
with  . The inner plot indicates the dynamics of the input rate with respect to time. We set
  Hz for
  (in seconds),
  Hz for
  ,
,  Hz for
  and
and  Hz for
  . (D) Network bursting dynamics in: (blue line) the SNN composed of 48 neurons and 12 dendrites. (red line) the ‘network’ replicated from the traces of voltage and store level in the mean field model with
  . Note that bursting events are recorded if the firing rate is >30 Hz in the SNN, while the burst frequency in the mean field model is the reciprocal of the period of the stable limit cycle.

