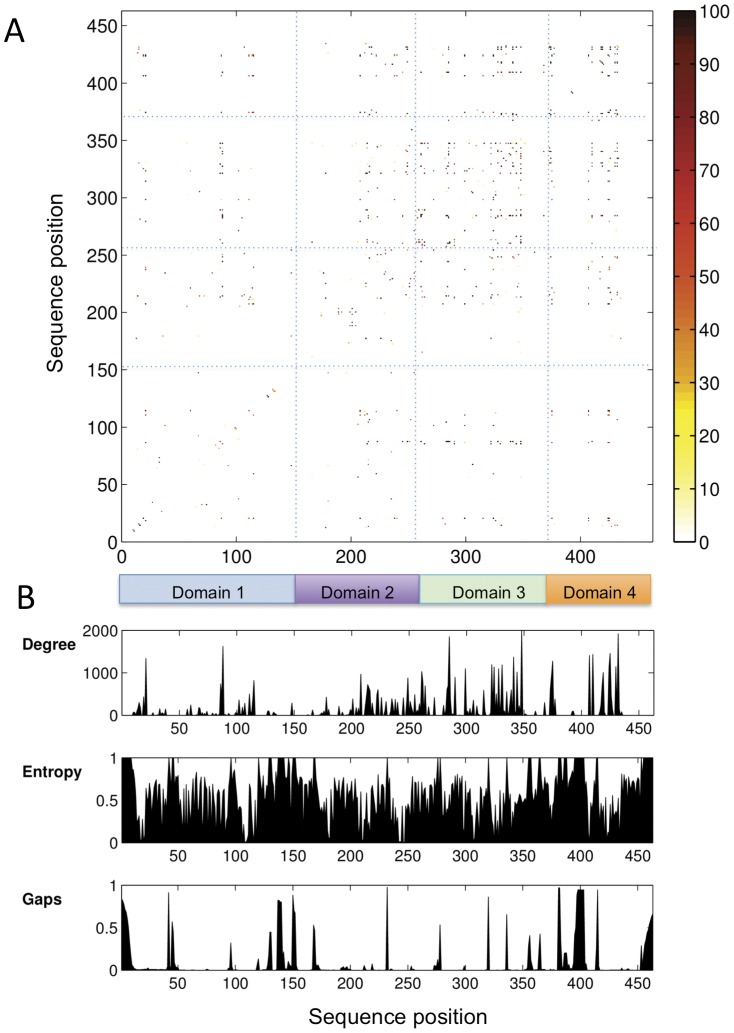
Figure 1. Results of the coevolutionary analysis.
(A) A matrix of rZNMI scores by residue for the PMM/PGM MSA (lower right triangle). Range (0–100) indicates the reproducibility of the residue couplings from the data resampling (Methods). Blue dashed lines separate regions of the matrix according to the domain of the protein. (B) Plots showing the degree (summation of reproducible couplings), entropy and gaps for each column of the rZNMI matrix. Colored boxes at top indicate the four domains of PMM/PGM: domain 1 (residues 1–154), domain 2 (residues 154–256), domain 3 (residues 257–368), and domain 4 (residues 369–463); numbers according to the P. aeruginosa enzyme sequence.

