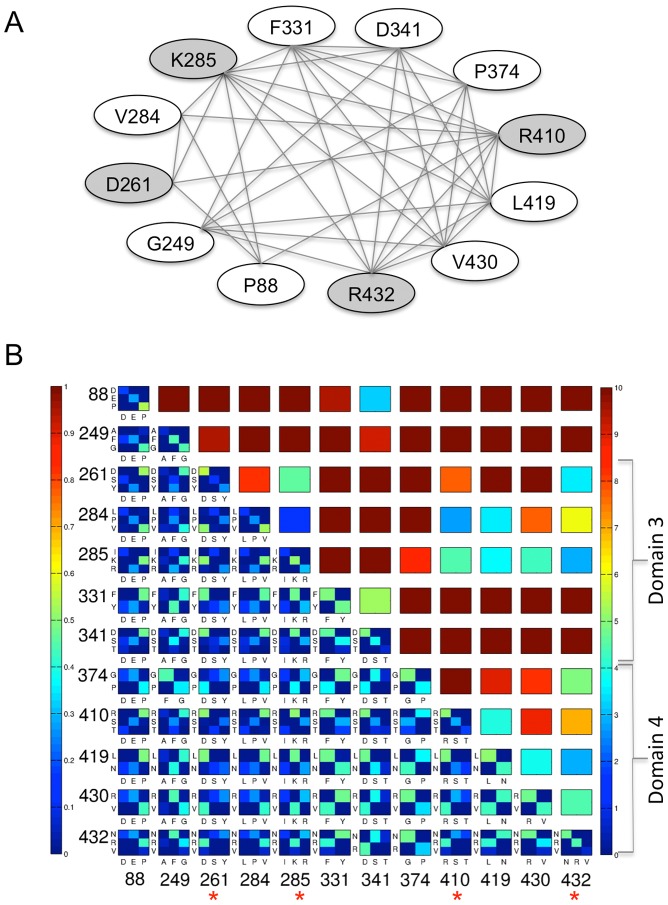
Figure 2. Results of the clique analysis.
(A) Graph illustrating the connections between the 12 residues (ovals) in the top cliques of PMM/PGM (see text). Gray shading highlights residues characterized in mutagenesis studies. Lines connecting ovals indicate that two residues are neighbors (in the same clique). (B) Upper right triangle: A contact map showing the distance between the closest atoms for each pair of top clique residues, from 0 (blue) to 10 Å (red); see color bar. Residues belonging to domains 3 and 4 of the protein are highlighted by brackets on right. The physical proximity of top clique residues in the domain 4 interface can be easily visualized by the patches of blue/green. Lower left triangle. An array of bi-variate histograms showing the joint amino acid identities between the top clique residues. Axes for the array are residue numbers; each histogram is labeled with amino acid types along axes i and j. Blue indicates low joint residue identity (0.0); red indicates high (1.0). Joint identities that occur at a frequency of less than 5% were removed for simplicity. Each histogram is normalized to its sum, and since all residues shown are co-varying (i.e., not completely conserved), the maximal score (red) is not possible for any pair. Residues along the bottom axis highlighted by asterisks were subject to study by mutagenesis.

