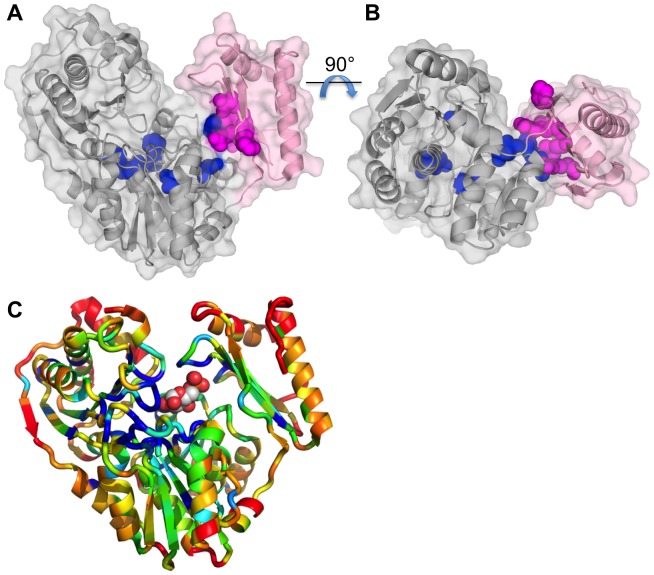
Figure 3. Structural context of the coevolutionary residue network.
(A) Ribbon diagram of PMM/PGM from P. aeruginosa (PDB ID 1K2Y) with a semi-transparent surface. Domain 4 (residues 369–463) of the protein is shown in pink; the first three domains are gray. The 12 top clique residues identified by the coevolutionary analysis are highlighted as space filling models in blue (domains 1–3) and magenta (domain 4). (B) Same as panel A, but rotated by 90° for an alternate view of the domain 4 interface. Note that the top clique residues in the interface form a contiguous patch that spans the width of the interface. (C) Ribbon diagram of P. aeruginosa PMM/PGM (PDB ID 1P5G) colored according to sequence conservation. Glucose 1-phosphate is shown as a stick model with green carbons. Conservation is calculated according to an entropy score (see Methods and Fig. 1B) where blue color indicates high and red indicates low conservation. Residues that were more than 10% gapped were assigned a value of 1. Figure made with PYMOL [63].

